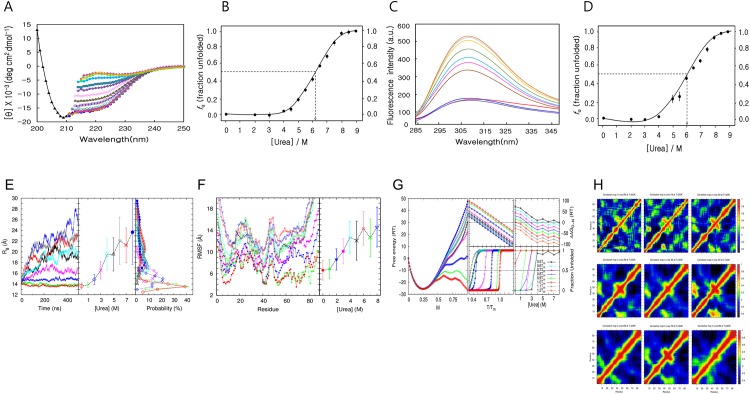
Fig 2. Unfolding of MTH1880 in the presence of urea.
(A) Data were acquired at 0 M (black triangle), 2 M (blue circle), 3 M (yellow diamond), (red square), 4.5 M (green circle), 5 M (magenta square), 5.5 M (dark green triangle), 6 M (red circle), 6.5 M (magenta filled diamond), 7 M (green square), 7.5 M (green triangle), 8 M (blue triangle), 8.5 M (khaki diamond) and 9 M (yellow circle) urea. (B) The fraction of unfolded protein extracted from far-UV CD spectra (25 μM) at 222 nm as a function of urea concentration was plotted and fit by a sigmoidal curve. The transition mid-concentration of urea (Cm) is 6.10 ± 0.15 M. (C) Fluorescence spectra acquired for urea concentrations ranging from 0 to 9.0 M. Data were acquired for 0 M (red line), 2M (fluorescent green line), 3 M (purple line), 4 M (blue), 6 M (brown), 6.5 M (magenta), 7 M (sky-blue), 7.5 M (khaki), 8 M (yellow), 8.5 M (light sky-blue) and 9 M (orange). (D) The fraction of unfolded protein extracted from fluorescence-emission spectra (25 μM) at 308 nm as a function of urea concentration was plotted and fit by a sigmoidal curve. The transition mid-concentration of urea is 6.00± 0.05 M. (E) Results from MD simulations. (Left panel) Rg of MTH1880 as a function of time, with urea concentrations ranging from 0 to 8 M at 300 K. (Middle panel) Rg averaged over 300,000 snapshots taken in the time window of 200 to 500 ns. The error bar denotes one standard deviation. (Right panel) The probability distribution of Rg is plotted for each urea concentration, and results in sharp distributions at low temperatures and broad distributions at high temperatures. (F) (Left panel) RMSF of MTH1880 by residue in the same time window, same temperatures and same urea concentration as (E). (Right panel) RMSF averaged over 88 residues. (E, F) This data were acquired for urea 0M(red filled circle), 1M(green filled triangle), 2M(blue filled triangle), 3M(red square), 4M(cyan cross), 5M(black cross), 6M(red circle), 7M(green triangle), and 8M(blue triangle). (G) Results from employing the extend ME model. Data were acquired for urea 0M(red circle), 1M(green cross), 2M(blue square), 3M(red cross), 4M(cyan square), 5M(black triangle), 6M(grey triangle), 7M(purple star), and 8M(blue filled circle). (Left panel) Free energy landscape of MTH1880 at 1.0Tm for each urea concentration as a function of M. (Middle top panel). The free energy of folding ΔΔGD-N (middle bottom panel) and the fraction of unfolded protein for each urea concentration, as a function of T/Tm. At T = Tm, ΔΔGD-N = 0, and the fraction of unfolding is 0.5. (Right top panel) The free energy of folding ΔΔGD-N (right bottom panel) and the fraction of unfolded protein for the temperature interval of 0.1Tm to 1.2Tm, as a function of urea concentration. At the transition mid-concentration of urea, ΔΔGD-N = 0, and the fraction of unfolding is 0.5. (H) Correlation matrix of MTH1880 is calculated from 300,000 snapshots in the same time window as (E) with urea concentration (Top left to right) 0M, 1M, 2M, (Middle left to right) 3M, 4M, 5M, (Bottom left to right) 6M, 7M and 8M.

