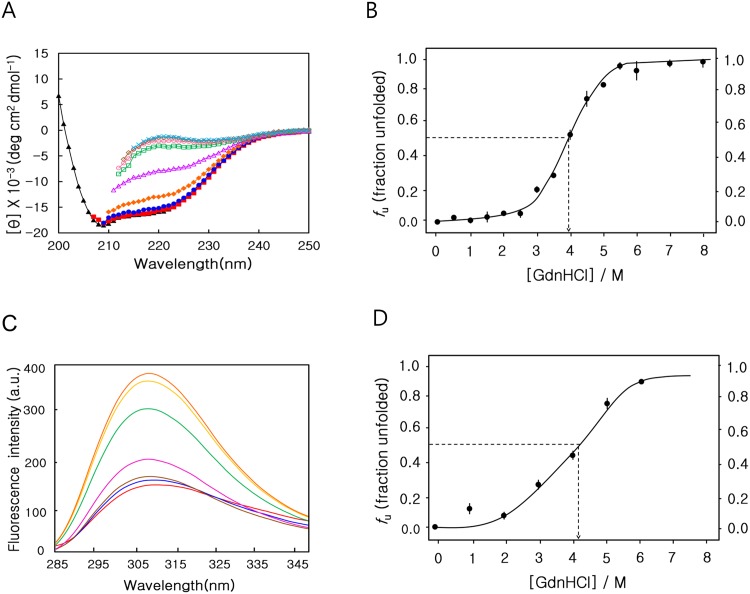
Fig 3. GdnHCl denaturation monitored by circular dichroism and fluorescence spectroscopy.
(A) Data were acquired at 0 M (black triangle), 1 M (red square), 2 M (blue circle), 3 M (hkaki filled diamond),4.5 M (red triangle), 5 M (green square), 6 M (red circle), 7 M (hkaki diamond), and 8 M (cyan cross) urea. (B) The fraction of unfolding extracted from far-UV CD spectra (25 μM) at 222nm as a function of GdnHCl concentration was plotted and fit by a sigmoidal curve. The transition mid-concentration of GdnHCl (Cm) is 3.95 ± 0.1 M. (C) Fluorescence-emission spectra for different GdnHCl concentrations ranging from 0 to 6.0 M. (D) The fraction of unfolding extracted from fluorescence-emission spectra (25 μM) at 308 nm, as a function of urea concentration, was plotted and fit by a sigmoidal curve. The transition mid-concentration of urea is 4.1 ± 0.05 M.

