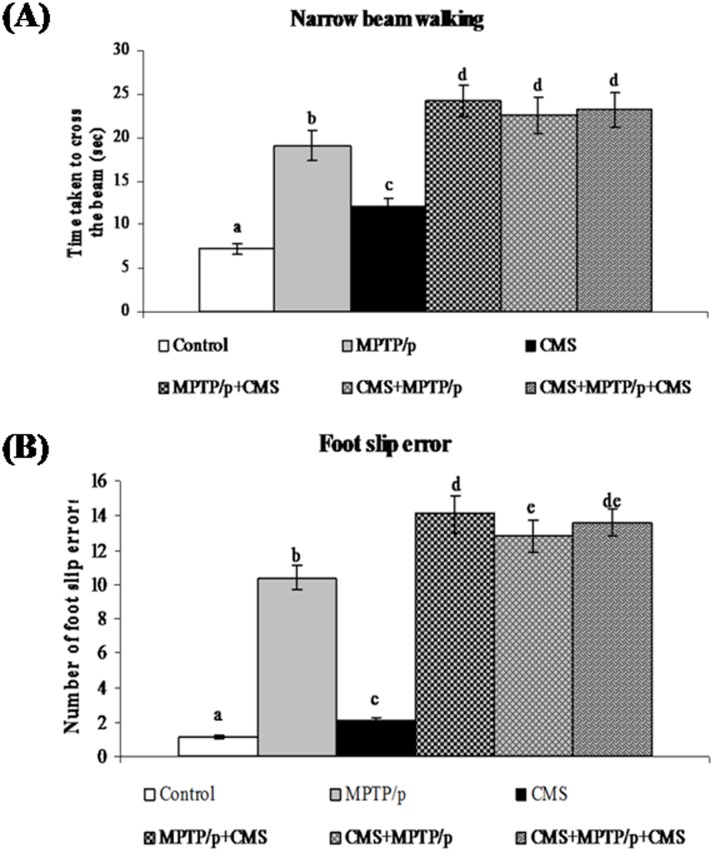
Fig 14. Effect of stress on narrow beam walking test of control and MPTP/p treated mice.
Time taken to cross the wooden beam (A) and number of foot slip errors (B) in narrow beam walking test were shown. Values are given as mean ± SD for six mice in each group. Values not sharing common alphabet differed significantly (P< 0.05) with each other.

