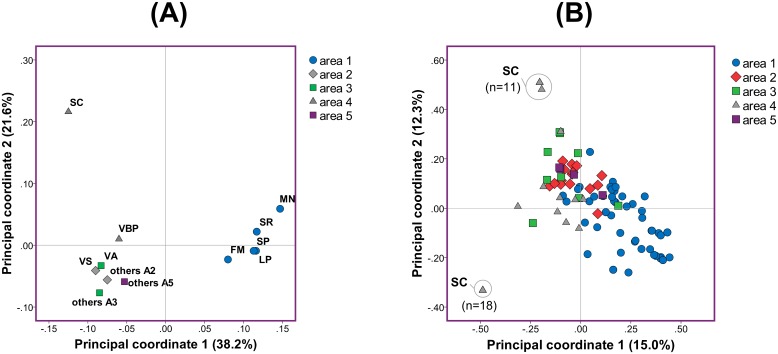
Fig 3. PCoA of the parasite population at village and individual haplotype level.
(A) Principal coordinate analysis of the study areas resulted from intercomparison of individual villages. Percentages in the parenthesis indicate the proportion of total variation explained by each principal coordinate. The term “others…” was used to group villages within specific areas that had less than 2 isolates with known haplotype. (B) PCoA among the individual haplotypes within the areas. Areas are defined in Fig 1A and village abbreviations are detailed in S1 Table.

