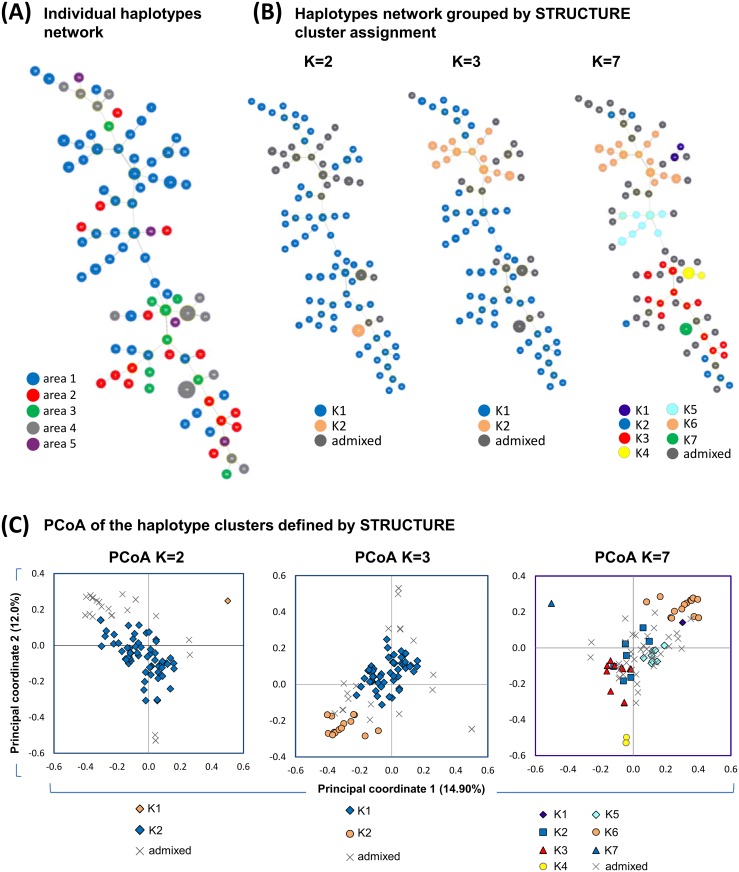
Fig 5. Phylogenetic relationship and PCoA of the P. vivax haplotypes arranged by the geographic origin and the genetic clustering.
(A) Network analysis displaying the phylogenetic relationship of the P. vivax haplotypes. The haplotypes are coloured following the area colour code displayed in the legend. The size of the nodes denotes the number of haplotypes transformed in logarithmic scale. (B) Phylogenetic relationships and PCoA of the isolates assigned into 2, 3 and 7 genetic clusters following STRUCTURE criteria. The nodes were coloured to discriminate their assignment to a genetic cluster (K1, K2…) or as an admixed haplotype and the node’s size varied as described previously. When K = 3 only 2 clusters are described (K1 and K2) since no isolate achieved effective assignment to K3. (C) The genetic distances among the haplotypes are described by the PCoA graphs and coloured according to the assignment to a specific genetic cluster or as admixed haplotypes. Percentages in the parentheses indicate the proportion of total variation explained by each principal coordinate.

