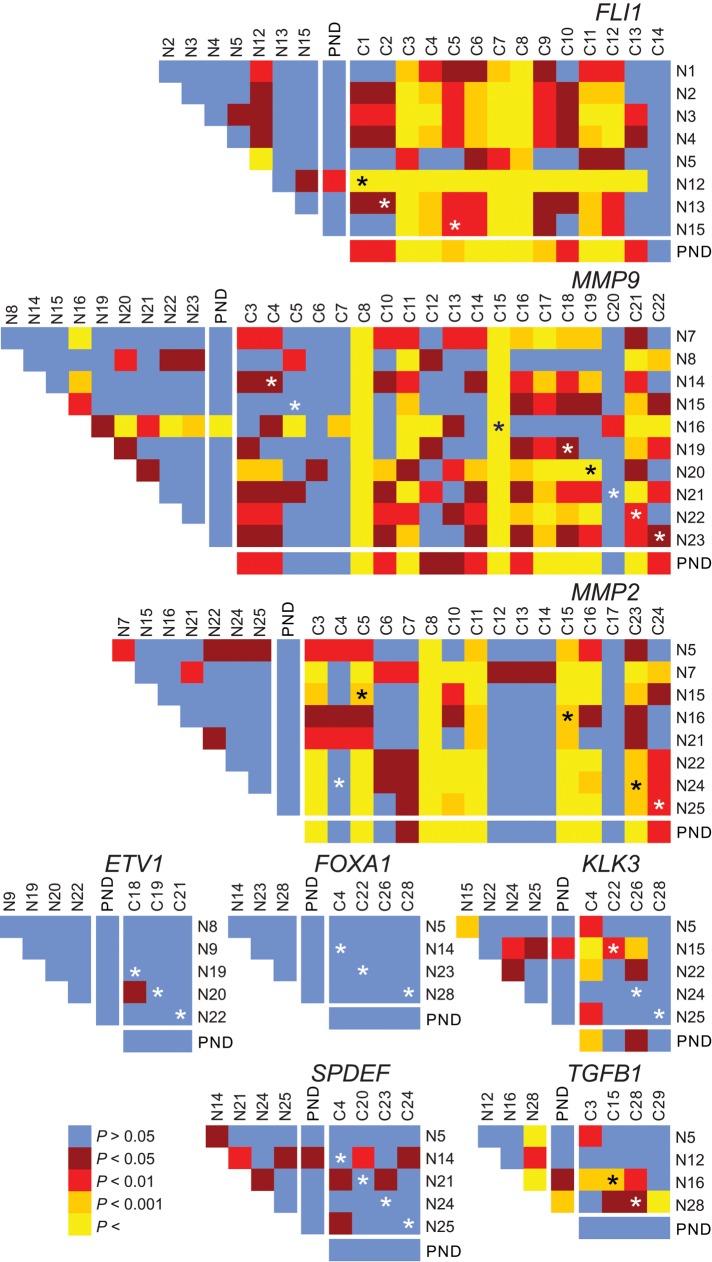
FIGURE 2:
Gene-specific repositioning in prostate cancer. Heat maps representing the pairwise statistical comparisons of radial positioning patterns of indicated genes among tissues using the two-sample 1D KS test. Although positioning patterns are statistically similar (blue, brown) among most normal tissues (N1–N28; see Supplemental Table S2), they can be divergent (red, orange, yellow) in cancer tissues (C1–C24; see Supplemental Table S2). Black and white asterisks indicate a cross-comparison between a normal and cancer specimens from the same individual. PND, pooled normal distribution.

