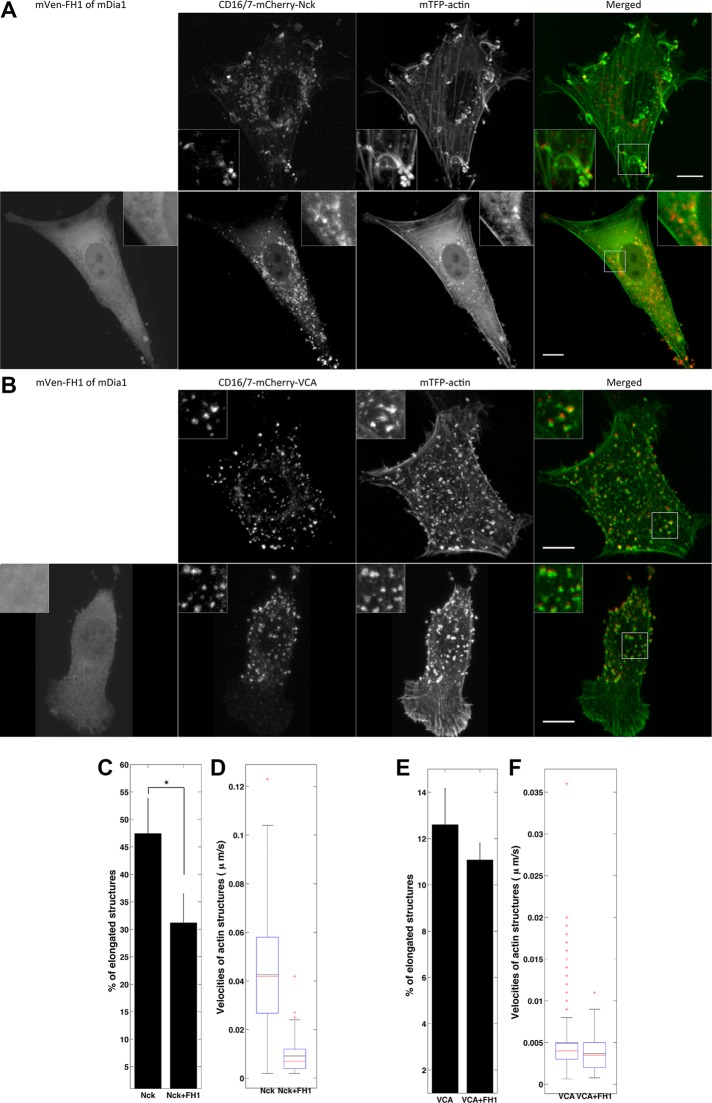
FIGURE 5:
Formin FH1 domain overexpression affects the shape and dynamics of actin structures induced by Nck SH3 but not those induced by VCA clustering. (A) Nck SH3–induced actin structures in cells without (top) or with (bottom) overexpression of formin FH1 domain. Merged images show the composites of CD16/7-mCherry-Nck SH3 and mTFP1-actin. (B) VCA-induced actin structures in cells without (top) or with (bottom) overexpression of formin FH1 domain. Merged images show the composites of CD16/7-mCherry-VCA and mTFP1-actin. Scale bars, 10 μm. (C) Morphology analysis of Nck SH3–induced actin structures in the control and in cells overexpressing formin FH1 domain. Control: three cells, 334 aggregates; FH1 overexpressing: three cells, 117 aggregates. Error bars are mean ± SEM. *p < 0.01. (D) Velocity analysis of Nck SH3–induced actin structures in the control and in cells overexpressing formin FH1 domain. Control: three cells, 201 aggregates; FH1 overexpressing: four cells, 86 aggregates. (E) Morphology of VCA-induced actin structures in the control and in cells overexpressing formin FH1 domain. Control: three cells, 420 aggregates; FH1 overexpressing: three cells, 248 aggregates. Error bars are mean ± SEM. (F) Velocity of VCA-induced actin structures in the control and in cells overexpressing formin FH1 domain. Control: three cells, 459 aggregates; FH1 overexpressing: three cells, 278 aggregates.

