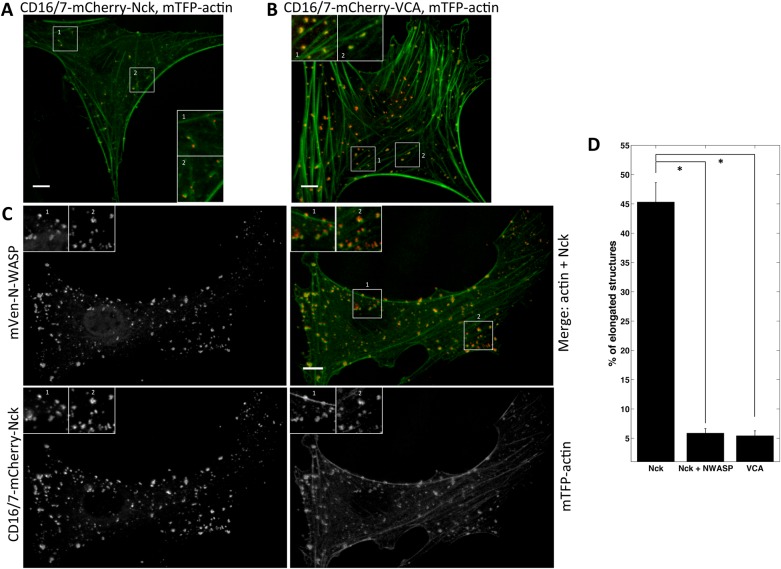
FIGURE 6:
N-WASP overexpression changes shape of Nck SH3–induced actin structures. (A–C) Actin structures induced by aggregation of Nck SH3 (A, C) or VCA (B) in NIH3T3 cells (A, B) or NIH3T3 cells overexpressing mVen-N-WASP (C). Cells were fixed. (C) mVen-N-WASP (top left), merge of mTFP1-actin (green) and Nck SH3 clusters (red; top right), CD16/7-mCherry-Nck (bottom left), and mTFP1-actin (bottom right). Scale bars, 10 μm. (D) Morphology analysis of Nck SH3–induced actin structures in the control and in cells overexpressing N-WASP. Nck-SH3: three cells, 200 aggregates; Nck-SH3 plus N-WASP overexpression: three cells, 329 aggregates; VCA: three cells, 250 aggregates. Error bars are mean ± SEM. *p < 0.001.

