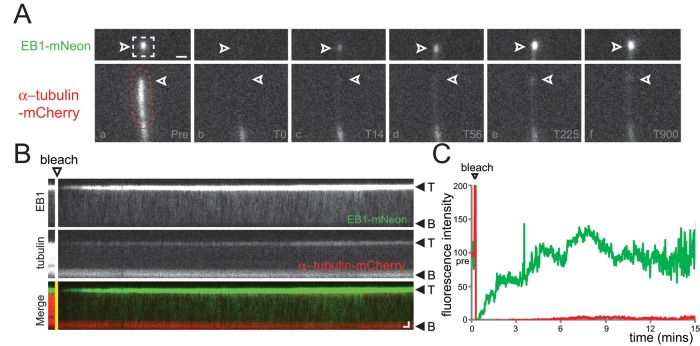
FIGURE 5:
Recovery of EB1-NG is not linked to tubulin exchange at the flagellar tip. (A–C) Gallery of individual frames (A), corresponding kymograms (B), and signal quantification (C) of a two-color FRAP experiment. (A) The distal flagellar region of a cell coexpressing EB1-NG and mCherry-α-tubulin was bleached using a laser spot that was moved along the flagellum (indicated by the dashed region), and FRAP was analyzed over several minutes (T0–T900 s). Top row, EB1-NG; bottom, mCherry-α-tubulin; arrowheads, flagellar tip. Scale bar: 1 μm. (B) Single-channel kymograms corresponding to A. The bleaching step and the orientation of the flagella are indicated. Scale bars: 1 μm and 10 s. (C) Quantification of the fluorescence intensity of EB1-NG (green) and mCherry-α-tubulin (red) corresponding to the photobleaching experiment depicted in A and B. The prebleach fluorescence intensity was set to 100 for both proteins; EB1-NG recovered rapidly and completely, while only traces of mCherry-α-tubulin were recovered even after 15 min of observation. See Supplemental Figure S4 for a similar experiment.

