
FIGURE 6:
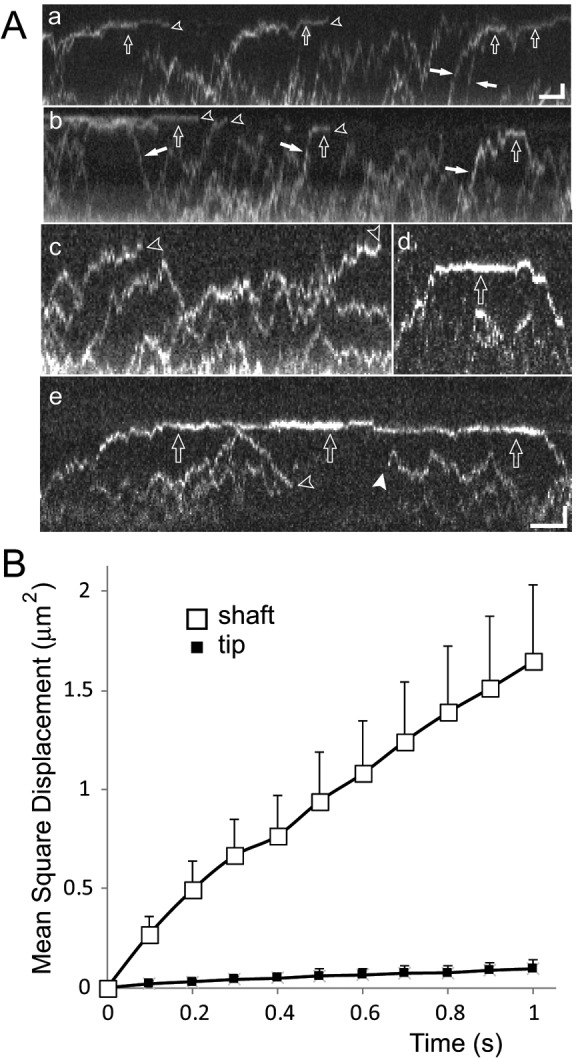
Differential mobility of EB1-NG explains its accumulation at the flagellar tip. (A) Gallery of kymograms depicting diffusion of EB1-NG in flagella. Open arrows, particles with reduced mobility near the flagellar tip; open arrowheads, bleaching events; white arrows, EB1-NG particles preferably moving in one direction along the flagellar shaft; white arrowhead, reappearance of photobleached EB1-NG as it is infrequently observed for NG-tagged proteins. Note the reduced mobility of particles approaching the tip (compare c with d and e), transiently stationary EB1-NG at the tip (a, b, d, and e), and the differences in the time EB1-NG remains trapped at the tip. Scale bars: (a and b) 1 μm and 2 s; (c–e) 1 μm and 1 s. (B) Mean-square displacement vs. time plots for EB1-NG particles moving in the flagellar shaft (open squares; n = 41) or tip segment (filled squares; n = 14).