FIGURE 4:
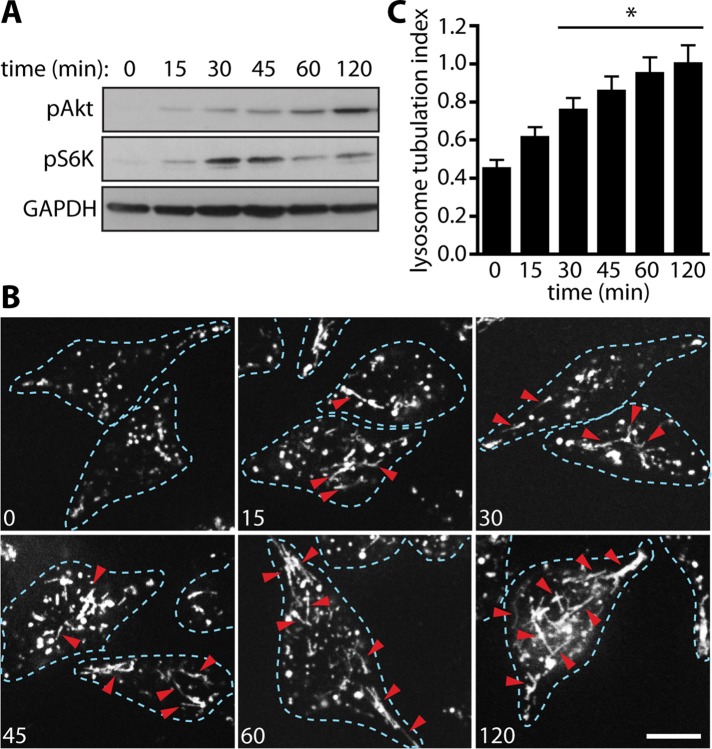
The Akt-mTOR pathway is activated early and maintained under LPS signaling and coincides with lysosome tubulation. (A) Western blots of RAW whole-cell lysates after LPS stimulation for the time points indicated across the top (in minutes). LPS stimulation caused phosphorylation of Akt and S6K as early as 15 min, increasing at 30 min and remaining for at least 2 h. (B) Lysosomes of RAW 264.7 macrophages labeled with Alexa 555–dextran. Cells were treated with LPS, and live-cell imaging was carried out at the time points indicated (in minutes). Dashed lines outline individual cells. Red arrowheads indicate lysosomal tubules. Scale bar, 10 μm. (C) Quantification of lysosome tubulation under conditions described in B. Data were statistically analyzed using a one-way ANOVA, followed by Tukey’s post hoc test. *p < 0.05, significant difference from 0-min condition.

