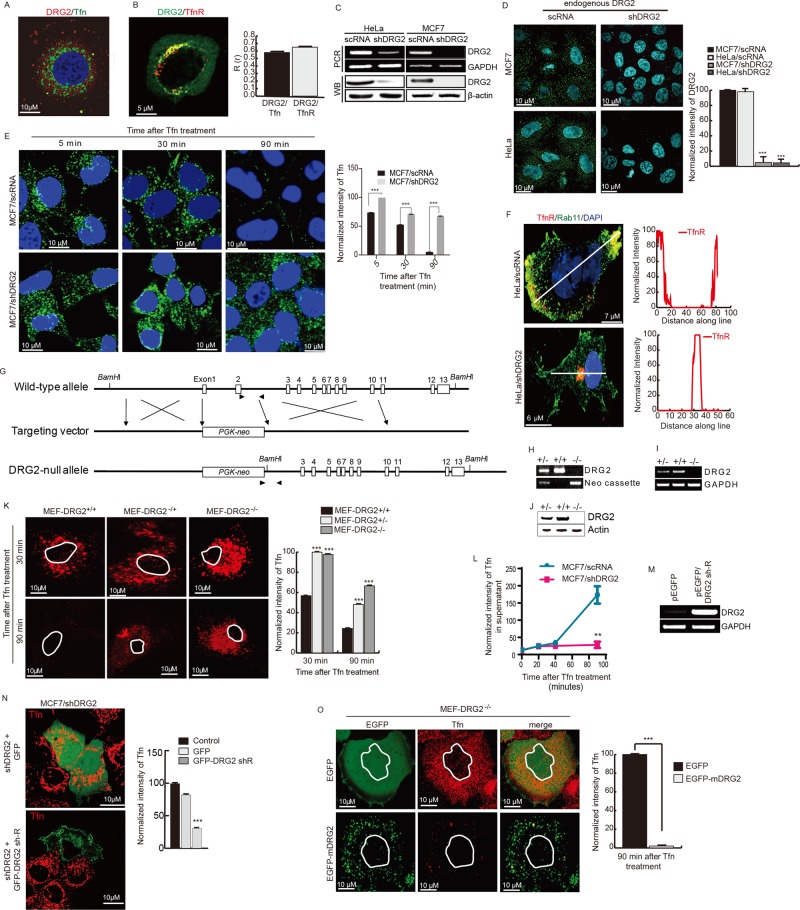
FIGURE 3:
DRG2 is required for Tfn recycling. (A, B) DRG2 colocalizes with Tfn and TfnR. (A) Endogenous DRG2 and Tfn–Alexa 647 (at 10 min after treatment) in MCF7 cells. (B) EGFP-DRG2 and mCherry-TfnR in HeLa cells after 10 min of Tfn treatment. Representative confocal images with magnified insets of boxed areas. Blue, DAPI staining. Graphs represent Pearson’s R(r) between DRG2 and Tfn or TfnR. Values are mean ± SD from three experiments, with 10 different cells per group per experiment. (C, D) Preparation of DRG2-depleted MCF7 and HeLa cells by using control (nontarget shRNA) or shRNA against DRG2 (shDRG2) using the pLKO vector. Depletion of DRG2 expression was confirmed by RT-PCR (C, top), Western blot (C, bottom), and fluorescence microscopy (D). (E) DRG2 depletion blocks Tfn recycling. Control and DRG2-depleted MCF7 cells were incubated with Tfn–Alexa 633 for the indicated times. Blue, DAPI staining. Graph represents the mean fluorescence intensities in arbitrary units. Values are mean ± SD from three separate experiments, with 10 different cells per group per experiment. ***p < 0.001. (F) DRG2 depletion blocks TfnR recycling. Confocal images of control and DRG2-depleted HeLa cells expressing TfnR-PAmKate and EGFP-Rab11 and incubated with Tfn for 60 min. Graphs represent linear pixel values across cells. Blue, DAPI staining. (G–K) DRG2 knockout blocks Tfn recycling. (G–J) Generation of DRG2 KO mice. (G) Schematic representation of structure of the DRG2 genomic locus and the targeting construct. Exons 1 and 2 of wild-type DRG2 were replaced by the PGK-neo cassette through homologous recombination, indicated by cross symbols. Positions of exons covering the entire coding region are indicated by open boxes. Paired arrowheads indicate the primer sets used for genotype determination. (H–J) Confirmation of DRG2 KO. (H) Genotyping. Genomic DNA from wild-type (+/+), heterozygous (+/–), and homozygous (–/–) mice was analyzed by RT-PCR using the primer sets indicated in G. Expression levels of DRG2 were analyzed by (I) RT-PCR analysis and (J) Western blot analysis. (K) MEF cells derived from wild-type (+/+), heterozygous (+/–), and homozygous (–/–) mice were incubated with Alexa 594–conjugated Tfn for indicated times. Representative confocal images. Graph represents the mean fluorescence intensities in arbitrary units. Values are mean ± SD from three separate experiments, with five different cells per group per experiment. ***p < 0.001. (L) DRG2 depletion blocks the release of internalized Tfn from MCF7 cells. After washing out of unbound Tfn–Alexa 594, Tfn released into the supernatant was analyzed at the indicated time points. n = 4. **p < 0.01. (M, N) Expression of shRNA-resistant DRG2 (DRG2 sh-R) rescues Tfn recycling. DRG2-depleted MCF7 cells were transfected with EGFP or EGFP-DRG2 sh-R. (M) Expression of DRG2 was confirmed by RT-PCR. (N) After incubation with Tfn–Alexa 594 for 90 min, images were obtained using confocal microscope. Graph shows the mean fluorescence intensities in arbitrary units. Values are mean ± SD from three experiments, with five different cells per group per experiment. ***p < 0.001. Scale bar, 10 μm. (O) MEF-DRG2−/− cells were transfected with the EGFP or EGFP-DRG2 and incubated with Cy3-conjugated Tfn for 30 and 90 min. Representative confocal images. Graph represents the mean fluorescence intensities in arbitrary units. Values are mean ± SD from three separate experiments, with five different cells per group per experiment. ***p < 0.001. Scale bar, 10 μm.

