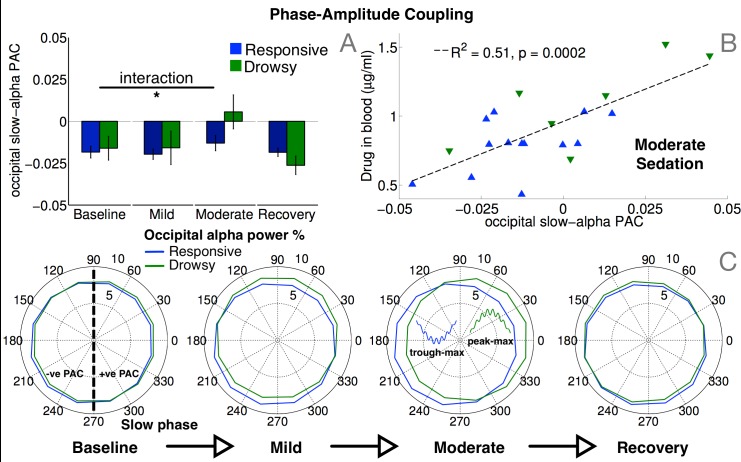
Fig 7. Phase-amplitude coupling (PAC) between slow and alpha oscillations.
Coupling between ongoing slow phase and alpha power over occipital channels delineated in Fig 5A (top left) shifted from a trough-max to a peak-max (C) distribution in the drowsy group during moderate sedation, resulting in a significant interaction between group and sedation in PAC values (A). Crucially, these subject-wise PAC values significantly correlated with drug concentrations measured in blood across both groups during moderate sedation (B).

