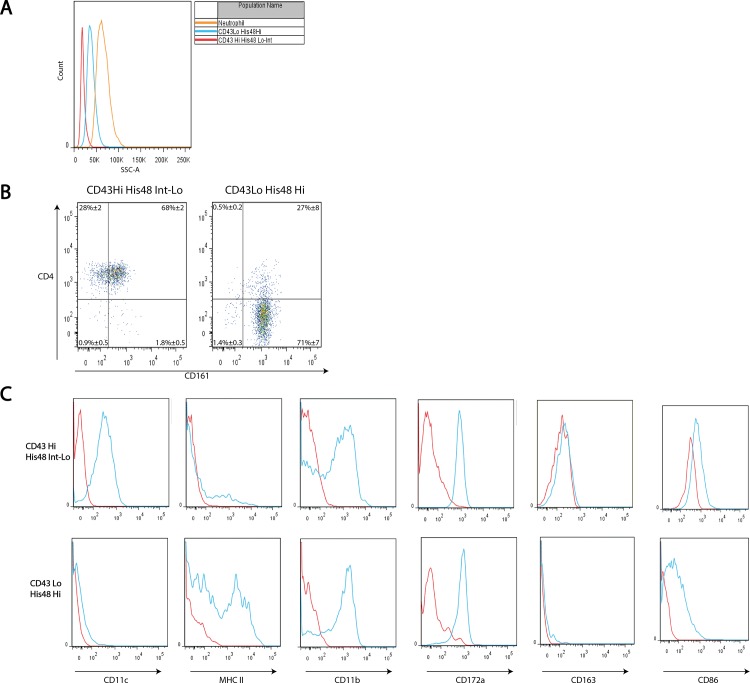
Fig 2. Rat monocyte subsets differ in granularity and cell-surface antigen expression.
‘CD43lo-His48Hi’ and ‘CD43Hi-His48Int-Lo’ blood monocytes and neutrophils were analysed by FCM for granularity by mean side-scatter (A). CD4 and CD161 expression was examined by FCM, with gates drawn according to FMO’s, quadrants presented as mean ± SEM from 3 rats (B). Surface expression of CD11c, MHC II, CD11b, CD172a, CD163 and CD86 were determined in relation to FMO’s by FCM, histograms are representative. Red histograms show the gated population’s FMO, blue histograms show the gated population’s fluorescence (C).

