
Fig 2. ref is a P1 lytic cycle gene.
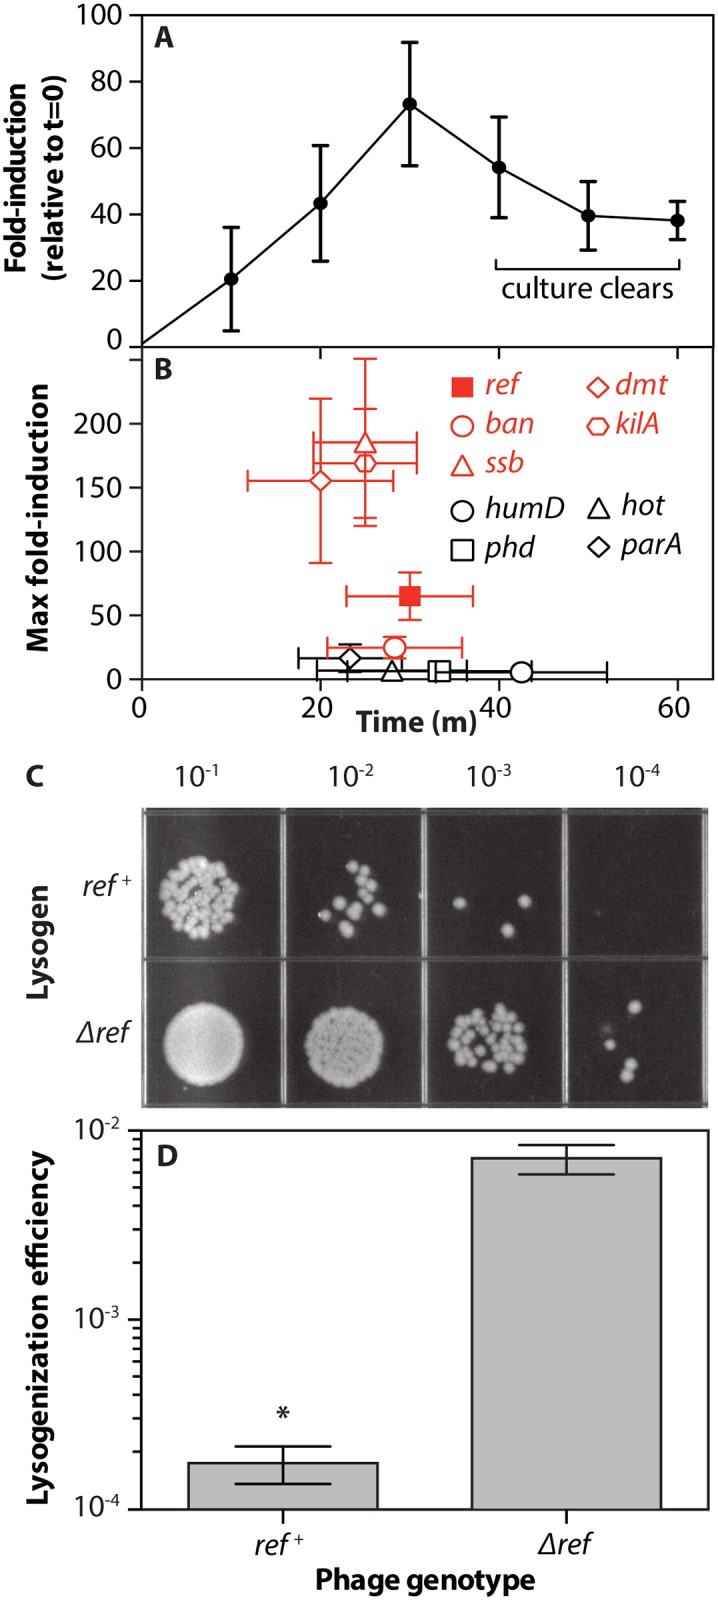
A. Rt-qPCR of P1 ref gene expression during temperature-induced lytic development of phage P1Cm C1.100. Total RNA was isolated and cDNA was obtained at times indicated. Portions of the ref (P1 phage) and cysG (E. coli) genes were amplified in triplicate using qPCR. Fold induction (y-axis) was calculated using the method of Livak and Schmittgen [56]. The average and standard deviation of three biological replicates is reported. B. Maximum fold-induction values for other P1 genes during the lytic switch, C1 repressor controlled genes = red. Fold-induction data was obtained and calculated as in A. Values within 20% of the maximum fold-induction for each gene in each biological replicate were averaged to obtain the maximum fold induction time and value for each gene. C. Lysogens formed upon infection of MG1655 with P1Cm C1.100. MG1655 culture was supplemented with CaCl2 and incubated with P1Cm C1.100 phage, followed by the addition of sodium citrate to chelate calcium ions and prevent superinfection. After recovery in LB, cells were serially diluted and plated on LB and LB/chloramphenicol (shown here) to select for phage lysogens. D. Colonies from plates in C were counted and the lysogenization efficiency (lysogens/viable cells) average and standard deviation from three biological replicate infections are reported. * = p-value<0.0001.