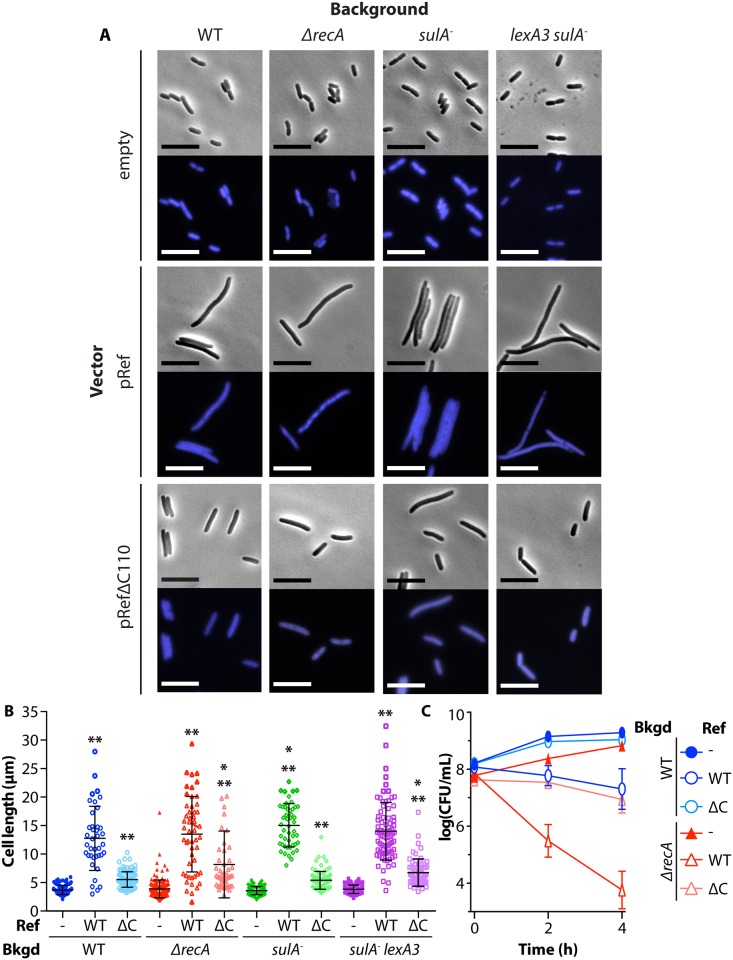
Fig 5. Ref expression causes cell filamentation independent of the E. coli SOS response.
A. Microscopy of cells expressing Ref or RefΔC110. WT E. coli strains EAR61 (EV), EAR62 (pRef), EAR73 (pRefΔC110), ΔrecA strains EAR64 (EV), EAR65 (pRef), EAR74 (pRefΔC110), sulA- strains EAR77 (EV), EAR78 (pRef), EAR79 (pRefΔC110), and sulA- lexA3 strains EAR69 (EV), EAR70 (pRef), and EAR75 (pRefΔC110) were grown to 1x10⁸ CFU/mL, treated with 1% arabinose, outgrown for 4 hours, and images were obtained as in Fig 4C. Scale bar = 10 μm, representative images shown. B. Quantification of cell length data from (A) was obtained using the MicrobeTracker plugin for MatLab. Each counted cell is represented by a single data point with the average and standard deviation for the data shown. An average of 90 cells (range: 39–188) were counted for each condition. ** = p-value <0.0001 when compared to EV in same background, * = p-value <0.05 when compared to same vector in WT background. C. Cell survival after expression of Ref. WT E. coli strains EAR61 (EV), EAR62 (pRef), EAR73 (pRefΔC110), ΔrecA strains EAR64 (EV), EAR65 (pRef), EAR74 (pRefΔC110) were treated as in (A). Cells were plated for viability and the average and standard deviation of at least three biological replicates for each condition are reported (error bars small and not visible in some cases). Significant p-values are noted in S1 Table.

