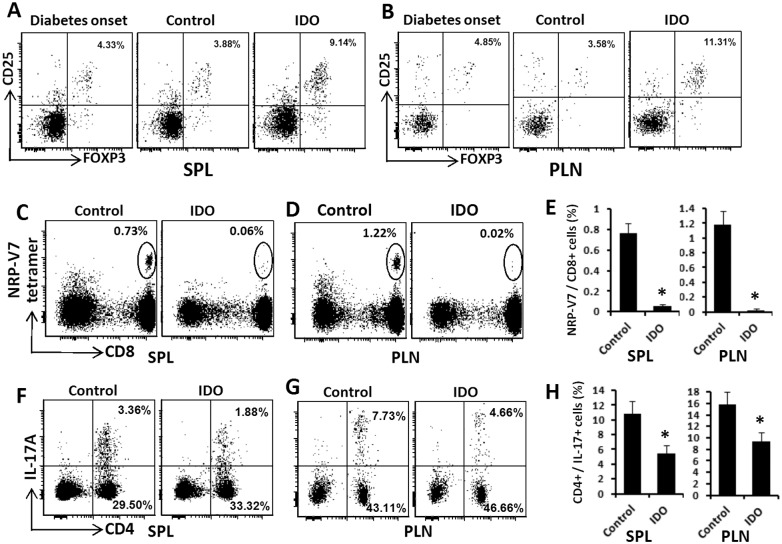
Fig 3. Frequency of regulatory, autoreactive CD8+, and Th17 T cells in NOD mice after cell therapy.
NOD mice received IDO-expressing fibroblasts upon initiation of spontaneous diabetes. At the endpoint of the study, spleens and pancreatic lymph nodes of these mice were harvested and frequencies of various subtypes of T cells were measured using flow cytometry. Panels A & B show the frequencies of CD 25+ FoxP3+ regulatory T cells (gated on CD4+ T cells) in spleens (SPL) and pancreatic lymph nodes (PLN) of mice, respectively. Autoreactive T cells were detected using NRP-V7 high-avidity peptide/MHC class I tetramers as described in Methods. Panels C &D show representative plots for CD8+ tetramer positive cells in spleen (SPL) and pancreatic lymph nodes (PLN) using a lymphocyte gate and excluding CD4+ and B220+ cells. The numbers in upper right corner of plots indicate the percentage of CD8+ B220- CD4- tetramer+ cells. Panels F & G show representative plots for IL-17 and CD4 flow cytometry analysis of lymphocytes in spleens (SPL) and pancreatic lymph nodes (PLN). The numbers in upper right corner of plots indicate the percentage of CD4+ IL-17+ (Th17) cells. Panels E & H show quantification of the frequencies of autorective CD8+ T cells and Th17 cells, respectively. (*) denotes significant decrease of inflammatory cells in IDO groups compared to the controls (P<0.001, n = 5).

