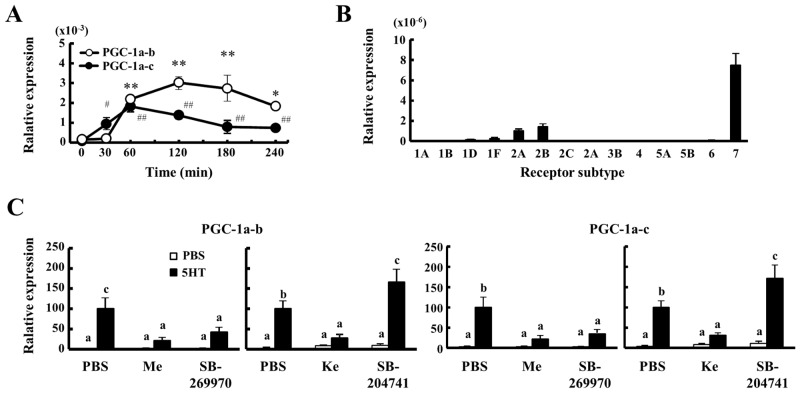
Fig 6. Elevation of mRNA Expressions of PGC-1α-b and PGC-1α-c by 5HT.
A, In 8 weeks of age mice, the mRNA expression levels of PGC-1α-b and PGC-1α-c were measured in soleus muscle and after i.p. injection of 1 mg 5-HT by real time PCR (n = 6–8). B, The relative mRNA expression levels of 5-HTR were measured in soleus muscle of mice at 8 weeks of age by using real time PCR (n = 6–8). C, At 30 min before the administration of 1 mg 5-HT, mice were injected with several 5-HTR antagonists: Methysergide (antagonist for 5-HTR1, 2 and 7, 0.1 mg/mouse), SB-269970 (5-HTR7, 0.6 mg), Ketanserin (5-HTR2A, 0.1 mg/mouse) and SB-204741 (5-HTR2B, 0.08 mg/mouse). The mRNA expressions of PGC-1α-b and PGC-1α-c in soleus muscle were determined at 120 min after 5-HT injection by real time PCR (n = 6–8). The mRNA expression levels in PBS-pretreated mice injected with 5-HT are designed as 100. Values in soleus muscle were normalized to those for 18S. Data are means ± s.e. Data were analyzed by Student's t test (A) and one-way ANOVA (C).*, P<0.05; **, P<0.01 relative to basal values at 0 min of PGC-1α-b. #, P<0.05; ##, P<0.01 relative to basal values at 0 min of PGC-1α-c. Columns with a different letter are significantly different (p<0.05).

