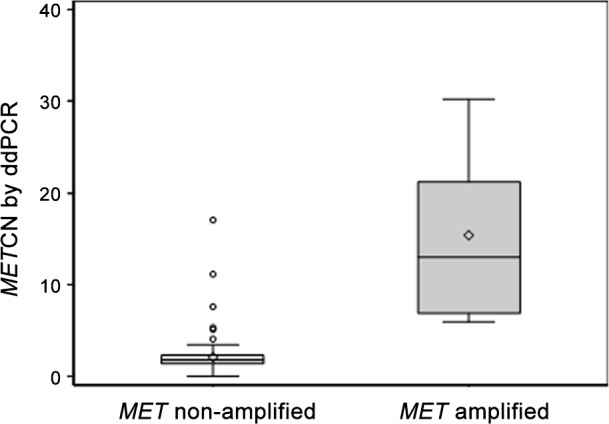
Fig 3. Measurement of MET copy number in PDX models using ddPCR versus FISH.

The data is based on a linear regression model that adjusts for FISH ratio with intercept. Solid line indicates fitting curve; gray box represents 95% confidence limits; dashed line depicts 95% prediction limits. Each data for MET CN using ddPCR represents two or three merged technical replicate wells with no template control (NTC) as a negative control.
