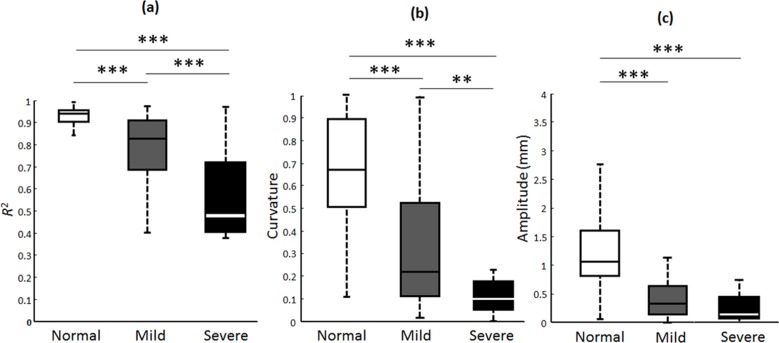
Fig 4. Box plots analysis for the R2, amplitude, and curvature estimates.
The calculated distributions of R2, amplitude, and curvature estimates of the fitted curves for the normal subjects, mild-CTS and severe-CTS patients were presented. The bisecting line, box boundaries, and whiskers indicate the median value, 25th to 75th percentiles, and the estimated data range, respectively. Two and three asterisks indicate p < 0.01 and p < 0.001, respectively. Normal, Mild, and Severe indicate normal subjects, mild-CTS and severe-CTS patients.

