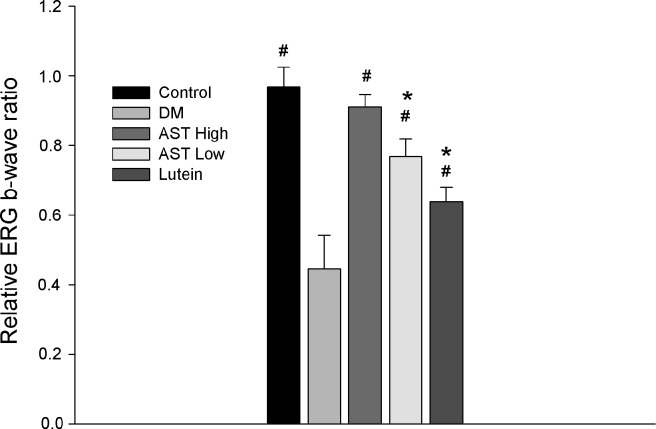
Fig 1. Evaluation of functional changes of the retina by electroretinography (ERG).
The ERG were performed on untreated rats (Control) or STZ-induced diabetic rats treated for 8 weeks with normal saline (Diabetes), 3 mg/kg AST (AST High), 0.6 mg/kg AST (AST Low), or 0.5 mg/kg lutein (Lutein). The relative b-wave ratio was significantly decreased in the Diabetes, AST Low and Lutein groups compared with the Control group. The relative b-wave ratio in AST High group had no significant difference from Control group. The ratio in AST High group was significantly higher than that in the AST Low and the Lutein groups (p = 0.046 and p < 0.001). The data are expressed as the mean ± SD in 4 rats for each group (bar graph). *, p < 0.05 compared with the control group. #, p < 0.05 compared with the Diabetes group. Differences among groups were analyzed by one-way analysis of variance followed by Bonferroni’s test for multiple comparisons.

