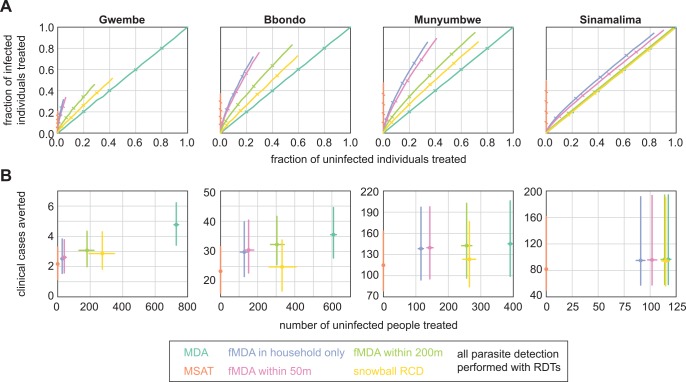
Fig 4. Infection detection strategies differ in ability to minimize overtreatment.
(A) Success of infection detection strategies at finding infected individuals while avoiding overtreatment of uninfected individuals. Results shown are means of 100 stochastic realizations per coverage level. Ticks indicate 20% steps in coverage. (B) Success of infection detection strategies at averting clinical cases while minimizing overtreatment at 80% coverage. Results shown are means and 95% confidence intervals of 100 stochastic realizations per coverage level. HFCA populations were normalized to 1000.

