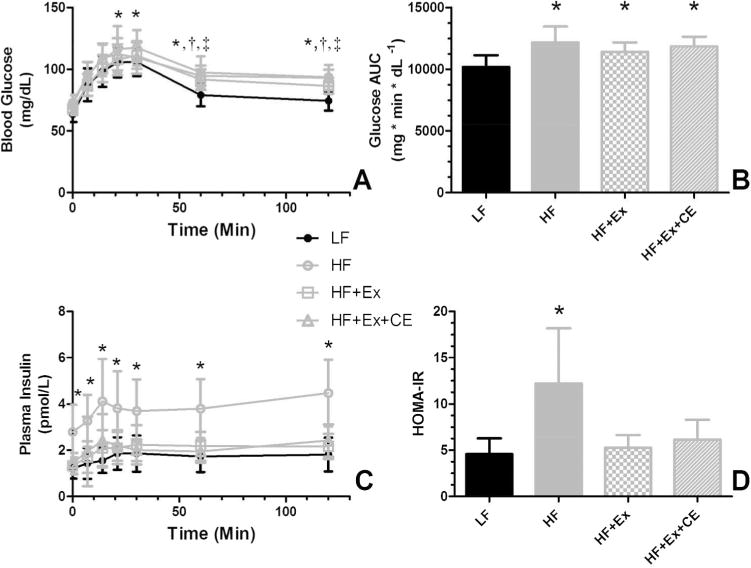
Fig. 2.

Supplementation with vitamin C and vitamin E does not block restoration of insulin sensitivity. Following 12 weeks of exercise or sedentary activity on the respective diets, rat underwent an OGTT. (A) Blood glucose levels over time. Note that the glucose over time curves for all HF-fed groups were significantly different than the LF control group. (B) Glucose AUC determinations derived from the glucose responses. Note that exercise while consuming the HF diet did not reduce the glucose AUC. (C) Plasma insulin levels during the OGTT. The insulin versus time curves for the HF sedentary groups was significantly different from those of the other groups. The LF and the exercising groups (HF+Ex and HF+Ex+CE) did not differ. (D) HOMA-IR scores derived from time zero data of the glucose and insulin curves. For (A) and (C), curves were compared using a repeated measures ANOVA with Tukey contrasts. For (B) and (D), data were compared using a 1-way ANOVA with Tukey contrasts and bars with different letters are significantly different (p < 0.05). Data in all graphs are the mean ± SD (n = 13 or 14). *, HF different from LF; †, HF+Ex different from LF; and ‡, HF+Ex+CE different from LF points. AUC, area under the curve; HF, high fat; HF+Ex, high fat with exercise; HF+Ex+CE, high fat with exercise with vitamin E and vitamin C; HOMA-IR, homeostasis model assessment of insulin resistance; LF, low fat; OGTT, oral glucose tolerance test.
