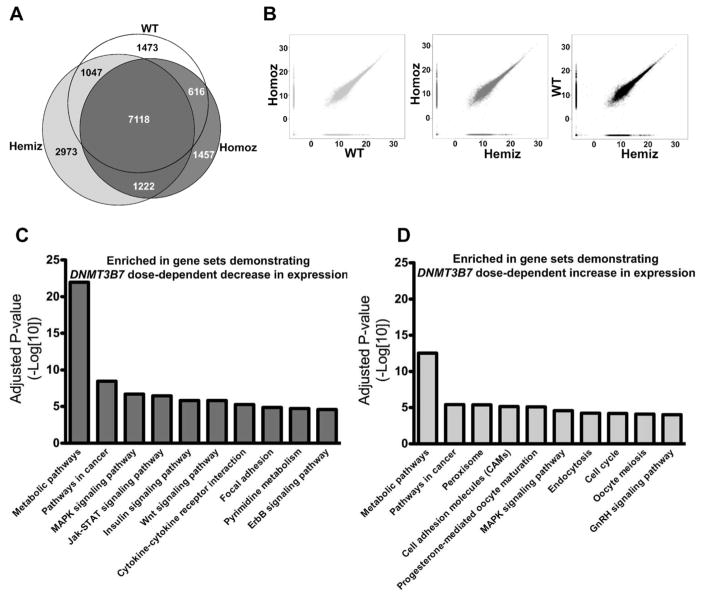
Figure 4. Enrichment of genes associated with hormone signaling pathways in LSK cells isolated from DNMT3B7 transgenic fetal livers from E14.5 embryos.
(A) Venn diagram depicting the number of unique genes expressed in WT (white), in DNMT3B7 hemizygous (light grey), and in DNMT3B7 homozygous (dark grey) LSK cells. Number of genes that overlap in all the three genotypes is in the center, and overlap of each pair of genotypes is shown at the intersection of the respective colors. (B) Pairwise M-A plots to visualize the extent of overlap between each pair of samples (WT vs. DNMT3B7 Homoz; DNMT3B7 Hemiz vs. DNMT3B7 Homoz; DNMT3B7 Hemiz vs. WT). Genes ordered by DNMT3B7 dosage effects were input into gene ontology pathway analyses, and enriched pathways are shown in (C) genes showing DNMT3B7 dose-dependent decrease and (D) genes showing DNMT3B7 dose-dependent increase in expression.

