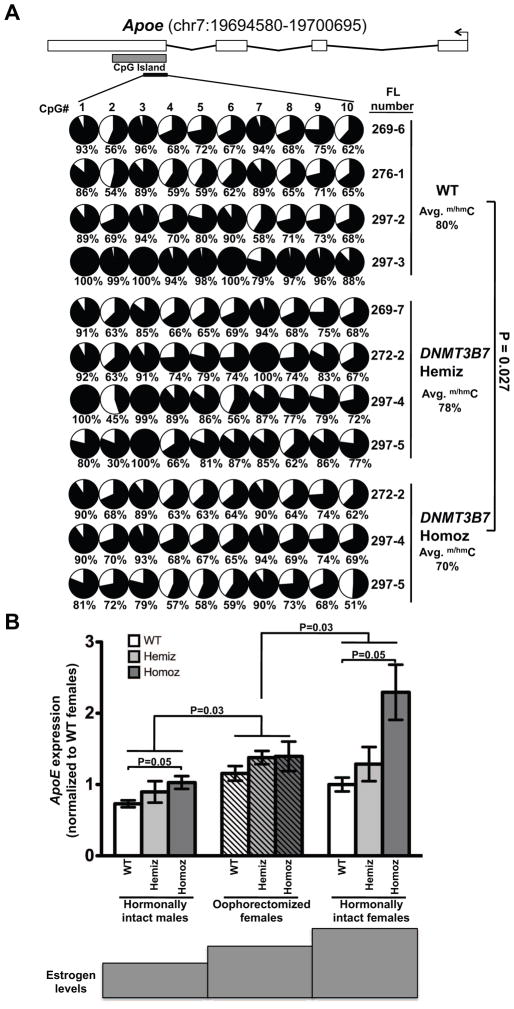
Figure 5. Reduction in DNA cytosine modifications in the CpG island of Apoe leads to increased Apoe expression in female mice transplanted with DNMT3B7 transgenic cells.
(A) DNA cytosine modifications in WT, DNMT3B7 hemizygous, or DNMT3B7 homozygous fetal liver cells measured by bisulfite sequencing around the CpG island of mouse Apoe (located within exon 4). Schematic diagram for Apoe is shown with exons represented by vertical rectangles, and the location of the CpG island shown with a horizontal shaded rectangle. The black arrow indicates the transcriptional start site (TSS). The smaller, black horizontal rectangle indicates the location of CpGs analyzed for changes in DNA cytosine modifications. Each row represents DNA methylation in a single E14.5 fetal liver, identified by the number on the right. Numbers across the top indicate specific CpG dinucleotides in a region of the CpG island. Changes in DNA cytosine modification are indicated by shaded circles, with the shading indicating average amount of DNA cytosine modification at each CpG, and numbers below represent percent modified cytosine. Average percent modification is indicated to the right, and P-values calculated using the two-tailed Student’s t-test. (B) Apoe expression in spleens isolated from hormonally intact males (left set of bars), oophorectomized females (middle set of bars), and hormonally intact females (right set of bars) receiving WT (white), DNMT3B7 hemizygous (light grey) or DNMT3B7 homozygous (dark grey) fetal liver cells. Relative expression was measured by real-time PCR and with β-Actin serving as the internal control and plotted normalized to WT hormonally intact females. Two-way ANOVA was used for comparison of the three groups, using genotype and gender as the two factors.

