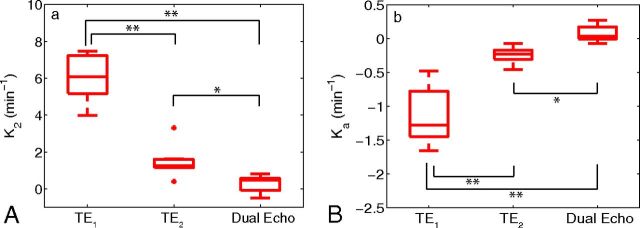
Fig 4.
Boxplots of median parameter estimates (from all patients) calculated at various TEs for K2 (A) and Ka (B). Boxplots display the median, 25th, and 75th percentiles (edges of box) and extreme data points (whiskers). Outliers are plotted individually (plus sign). Significance was determined by the Mann-Whitney U test. * indicates P < .01; **, P < .001. Note: Positive outlier for K2 at TE1 not pictured.

