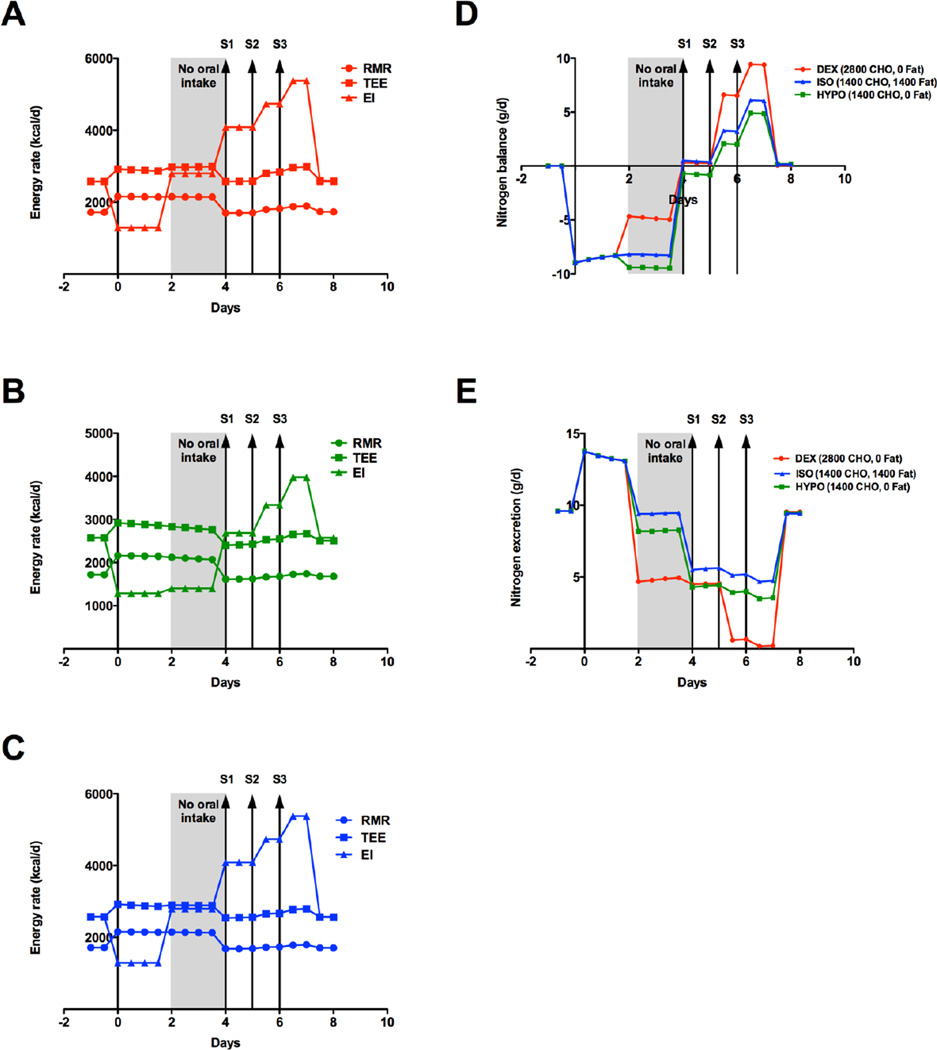
Figure 2.
Energy and nitrogen balance during acute metabolic decompensation due to infection/anorexia. Energy intake was reduced by 500 kcal/day, simulating anorexia, and RMR was increased by 500 kcal/day to account for proteolysis (temperature of 40°C) starting at Day 0. Resting metabolic rate (RMR, circle), Total Energy Expenditure (TEE, square) and Energy Intake (EI, triangle) for A) dextrose alone (DEX, red), B) hypocaloric dextrose (HYPO, green) or C) isocaloric dextrose/lipid (ISO, blue). D) Nitrogen balance and E) nitrogen excretion for DEX (red), HYPO (green), ISO (blue). Dietary descriptions are included in the text. Kcal/d – kilocalories per day.

