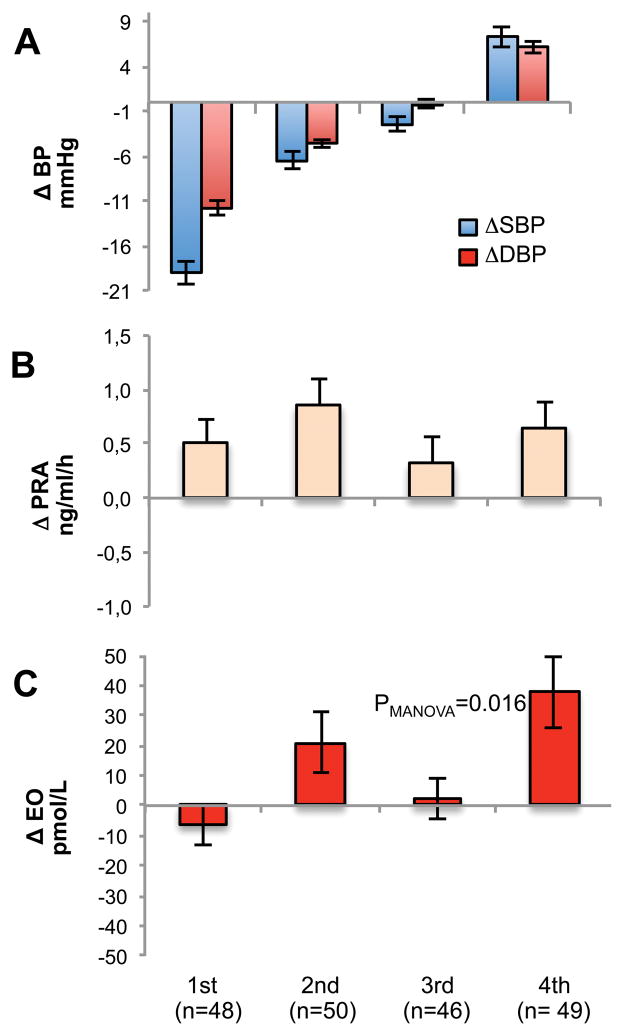
Figure 1.
Panel A, changes in systolic (blue bar) and diastolic (red bar) BP among the quartile groups. The 1st quartile group exhibited the greatest fall in BP in response to low salt intake. The 4th quartile group showed a “parodoxical” increase in BP. Panel B. Changes (Δ) in PRA in the 4 groups from baseline. Panel C. Changes (Δ) in plasma EO from baseline.

