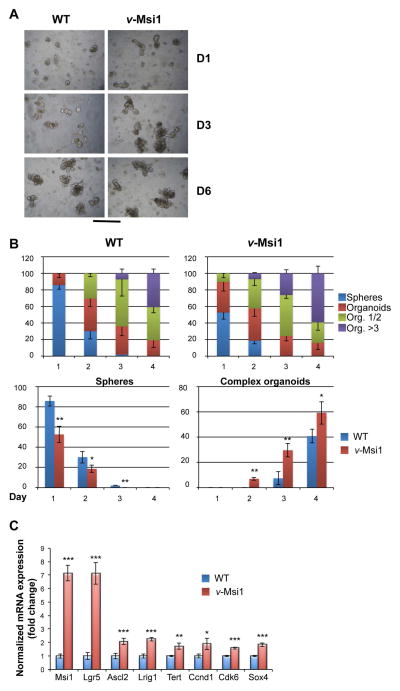
Figure 7. Increased growth potentialities of v-Msi1 cultured crypts.
A) Crypts were prepared from WT or v-Msi1 intestine as indicated and maintained in culture for several days, allowing complex organoid development and structuration. Pictures in (A) have been taken under inverted microscope at the indicated days after the start of the culture, and are representative of two independent experiments, each conducted on six replicates. Bar=50μm. B) The number of simple structure (spheres) or organoids of increasing complexity (1 or 2 buds, more than 3 buds) were scored under the inverted microscope during the first four days of culture. Multilayered histograms in the upper panels represent the mean ± SD, n=6, of each counted structure in the cultured crypts of indicated genotype. Histograms in the lower panels show the direct comparison of the number of spheres and that of complex organoids depending on the genotype. *: P<0.05, **: P<0.01, in comparison with WT, by Student’s t-test. C) RT-qPCR analysis of indicated stem cell markers and MSI1 targets in organoids of different genotype. Values represent fold change ± SD, n=4, after normalization to WT organoids. *: P<0.05, **: P<0.01 and ***: P<0.001, in comparison with WT, by Student’s t-test.

