
Figure 2.
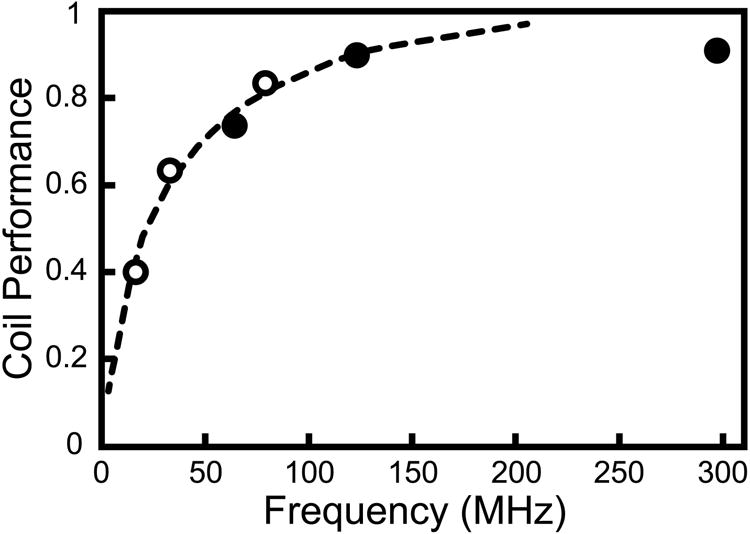
Coil performance for an 8 × 10 cm surface coil loaded by a tissue equivalent phantom, given as percentage of actual coil SNR compared to the same coil with no coil losses, based on Q measurements. Dotted line is a least squares fit to the data excluding the 297 MHz data point. Solid circles are 1H frequencies and open circles are 23Na frequencies at 1.5, 3 and 7T.