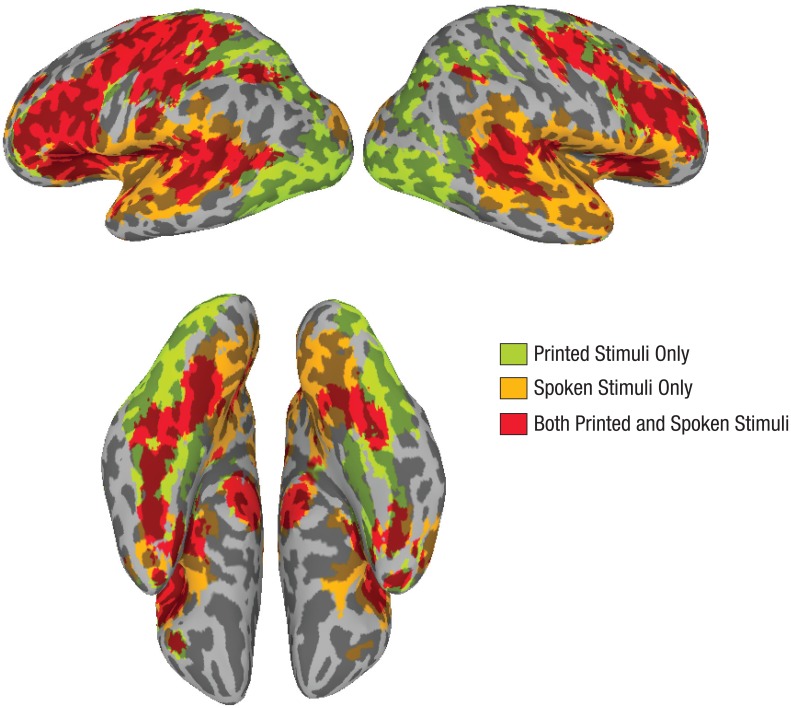
Fig. 1.
Brain regions that showed significant (p < .01) activation across the sample in response to printed stimuli only, spoken stimuli only, and both printed and spoken stimuli. The top images are lateral views, and the bottom images are inferior views. For both views, the left hemisphere is shown on the left and the right hemisphere on the right.

