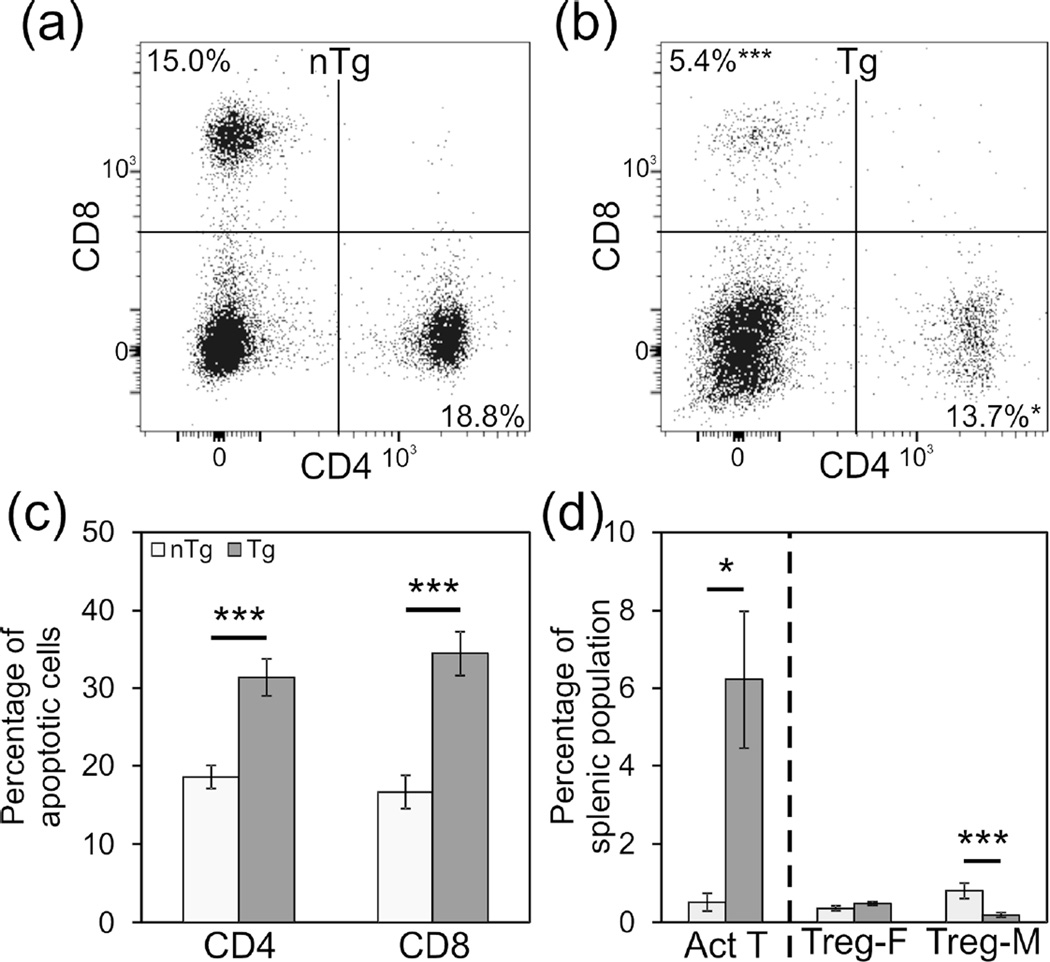
Figure 7.
Relative abundance of some T cell subsets are altered and rates of apoptosis are increased in the spleens of Lck-cre transgenic (NZB × NZW)F1 mice. Representative plots displaying splenic CD4+ and CD8+ populations for non-transgenic (a) and Lck-cre transgenic (b) mice are shown. Rates of apoptosis for single positive T cells, measured by Annexin V and PI staining, are also displayed (c). The relative abundance of activated T cells is displayed as a percentage of total CD4+ cells, and for Tregs is displayed as the percentage of total cells (d). N=6–12 mice per genotype (*, p<0.05; ***, p<0.005).

