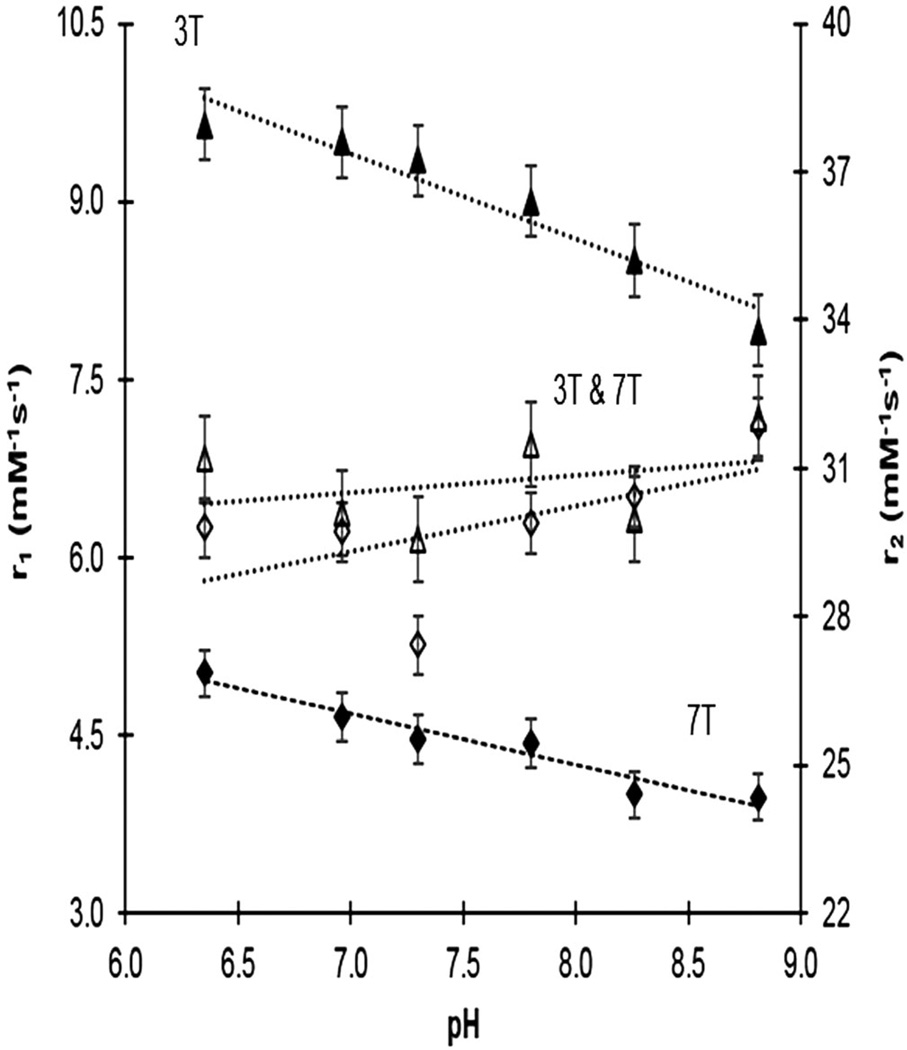
Figure 2.
Longitudinal and transverse relaxivities (r1 and r2, mM−1 s−1) as a function of pH (6.35–8.84) in liquid phantoms measured at 3 T (triangles) and 7 T (diamonds), with linear regression fits to the data. Transverse relaxivity does not vary significantly with pH, or with field strength. The slopes of the longitudinal relaxivities do not differ between the field strengths.

