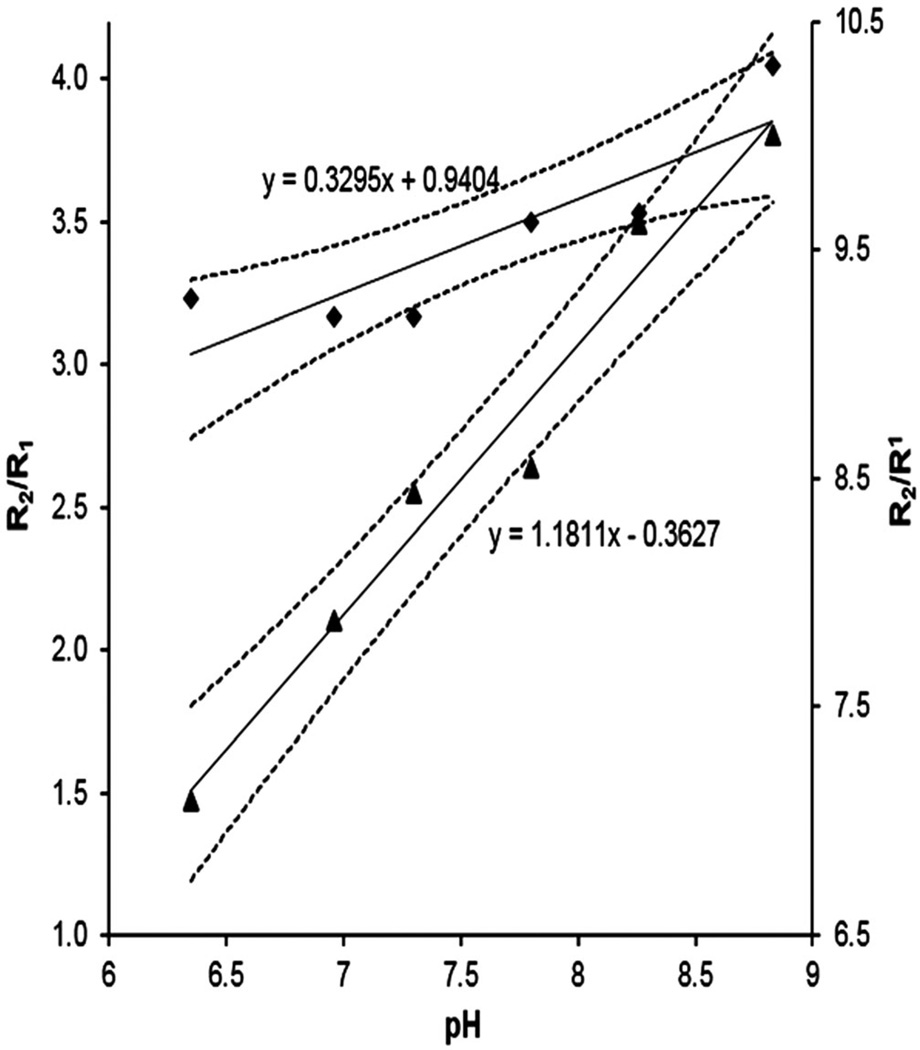
Figure 5.
R2/R1 versus pH plots. Left-hand ordinate, 3 T values; right-hand ordinate, 7 T values. The pH dependence of the relaxation rate ratio is shown with regression lines. Upper line (diamonds), 3 T data; bottom line (triangles), 7 T data. The 95% confidence intervals are plotted for both linear regressions.

