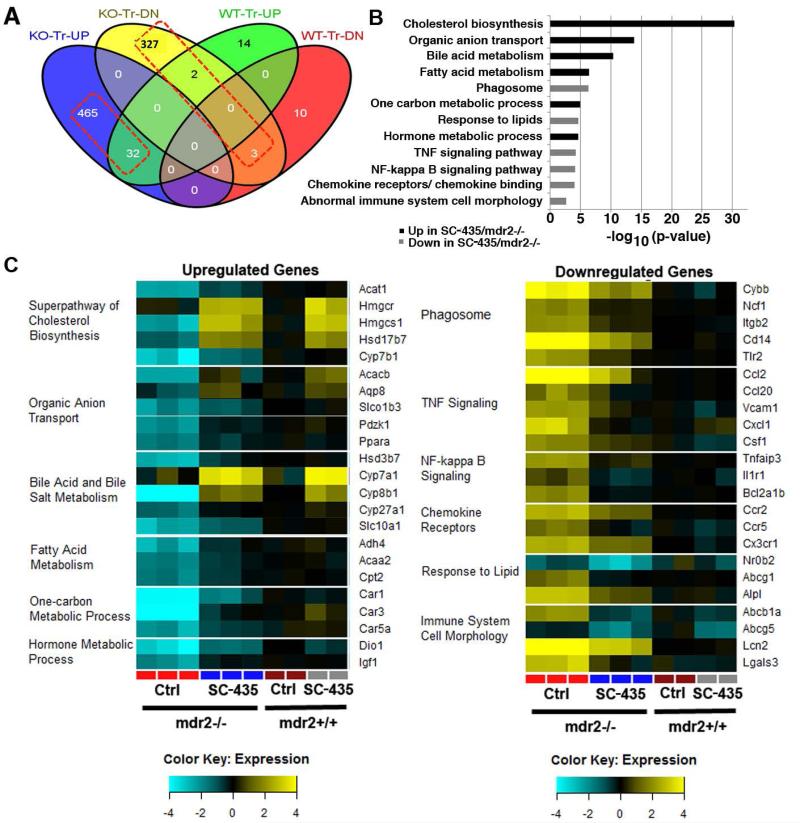
Figure 4. SC-435 treatment is associated with hepatic upregulation of genes controlling BA pool size and putative hepatoprotective genes and downregulation of pro-inflammatory genes.
RNAseq studies were performed on total hepatic RNA from mice of the four treatment groups. Distribution of up- and downregulated genes (>2-fold difference) compared to untreated mice of the respective genotype (knockout [KO] and wild type [WT]) across the different treatment groups is depicted in a Venn diagram (A). Based on pathway enrichment analysis, 12 pathways comprising significantly up- or downregulated genes in SC-435 treated mdr2−/− compared to mdr2−/− control mice are depicted with p values for these pathways plotted as −log10 (B). 23 genes from the up- and downregulated pathways, respectively, are displayed in the heatmaps with expression levels normalized to control mdr2+/+ mice (C).

