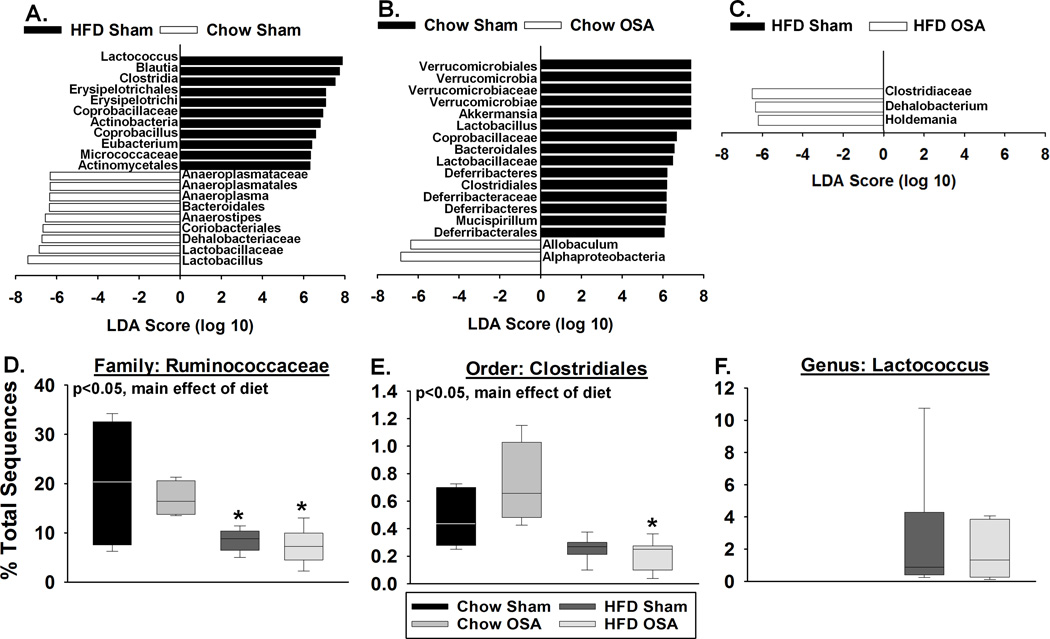
Figure 3.
Diet and OSA alter the relative abundance of multiple bacterial taxa. LEFSe analysis was used to identify and calculate a linear discriminate analysis (LDA) score for taxa that characterize (A) high fat diet vs. chow fed sham rats, (B) OSA vs. sham chow fed rats, and (C) OSA vs. sham high fat fed rats (n=4-7). In panels A-C, positive LDA scores indicate the enrichment of taxa in condition 1 (black) relative to condition 2 (white), and negative LDA scores indicate the depletion of taxa in condition 1 relative to condition 2. Given this relationship, the negative LDA scores can also be interpreted as enrichment in condition 2 (black) relative to condition 1 (white). Effects of diet and OSA on (D) Ruminococcaceae, (E) Clostridiales, and (F) Lactococcus abundance. HFD=high fat diet. Data are shown as the median and quartiles. n=4-7, *p<0.05 for high fat diet sham or OSA vs. respective chow groups.

