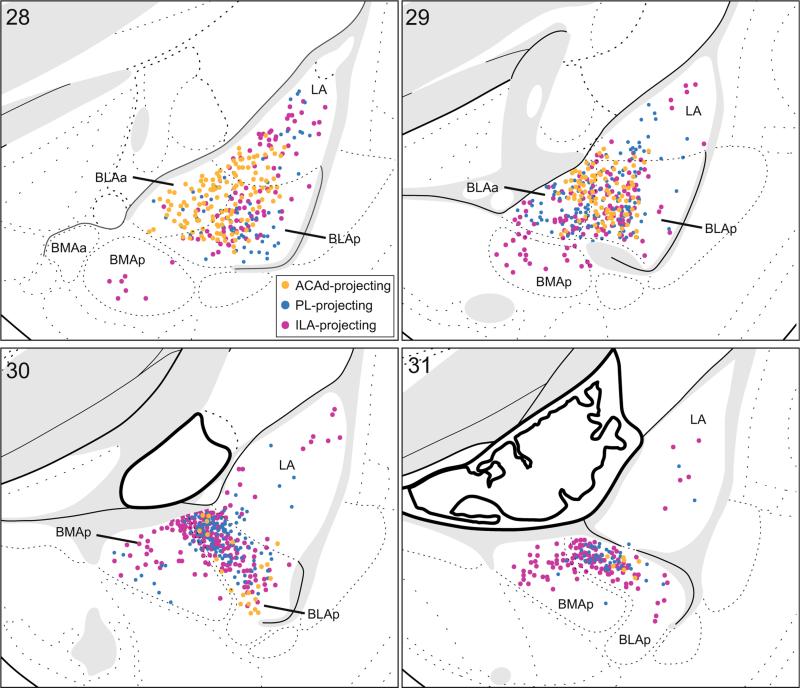
Fig. 6.
Topographical distribution of basolateral area projections to the mPFC. Combined labeling plots in the amygdala following ACAd (orange; from Fig. 2c), PL (blue; from Fig. 3c), and ILA (pink; from Fig. 4c) injections. Labeled neurons were plotted onto rat brain templates derived from Swanson (2004), arranged from rostral to caudal. Numbers denote atlas levels

