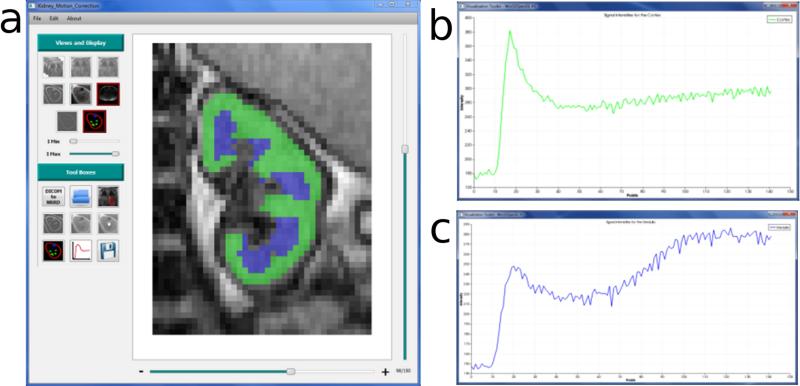
Figure 4.
Region-of-interest (ROI) analysis using our developed software. a) The user interface of the software displays control buttons that enable efficient post-processing of MRR data. In the stage of processing shown, ROIs have been drawn for the cortex (green) and medulla (blue). After drawing the ROIs, averaged signals within each ROI are automatically converted to tracer concentration based on algorithms embedded in the software. b) Tracer concentration vs. time curve for the cortical ROI. c) Tracer concentration vs. time curve for the medullary ROI.

