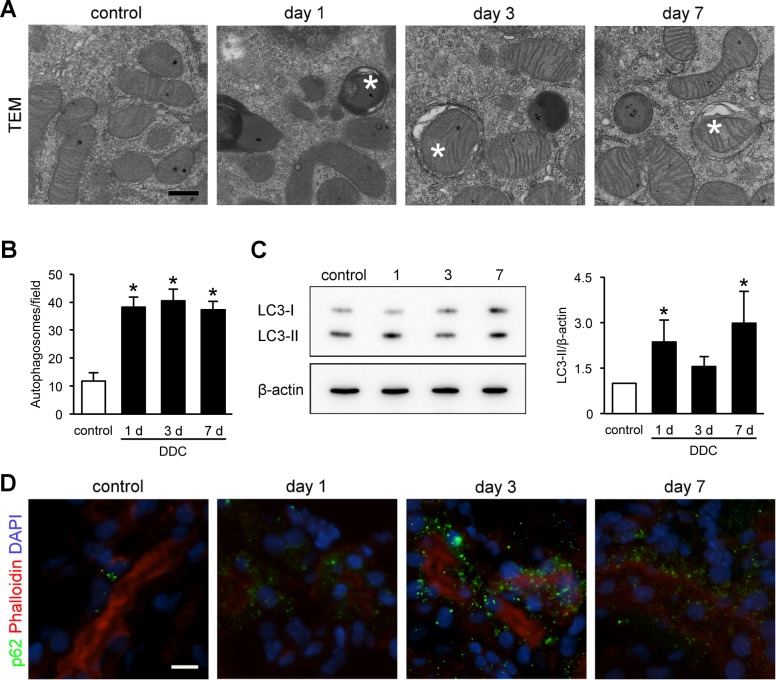
Fig 5. Mitochondrial damage and subsequent autophagy in the kidneys of 3,5-diethoxycarbonyl-1,4-dihydrocollidine (DDC)–fed mice.
(A) Representative transmission electron microscopic images of autophagosomes in the proximal tubules of kidneys from control and DDC-fed mice at days 1, 3, and 7; asterisks, autophagosomes. Scale bar = 500 nm. (B) Counts of autophagosomes per 1,000× magnified field; control (white bar) and DDC-fed mice (black bar) at days 1, 3, and 7. (C) LC3-I and LC3-II protein expressions in the kidneys of control and DDC-fed mice at days 1, 3, and 7 by immunoblot analysis; β-actin served as a loading control; control (white bar) and DDC-fed mice (black bar) at days 1, 3, and 7. (D) Representative images of p62 immunostaining in kidneys of control and DDC-fed mice at days 1, 3, and 7; green, immunofluorescence labeling for p62; red, phalloidin; blue, diamidino-2-phenylindole (DAPI). Scale bar = 10 μm. Data are presented as means ± SEM. *P < 0.05 compared with control mice.

