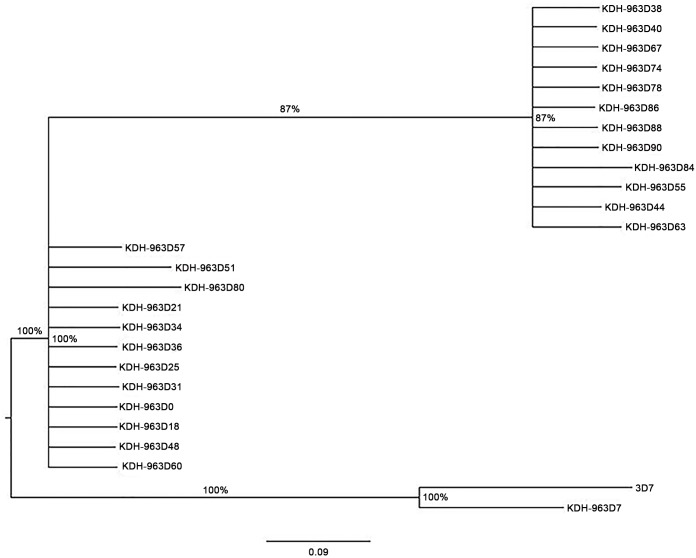
Fig 2. Phylogeny tree diagram for SNP data.
Phylogeny tree constructed using SNP haplotypes of samples in H63 parasite-line. The SNP haplotype profiles are shown in S3 Table. Bayesian algorithm was used to infer the number of genetically related clusters from the individual SNP haplotype profiles generated using the 30-drug resistance SNPs.

