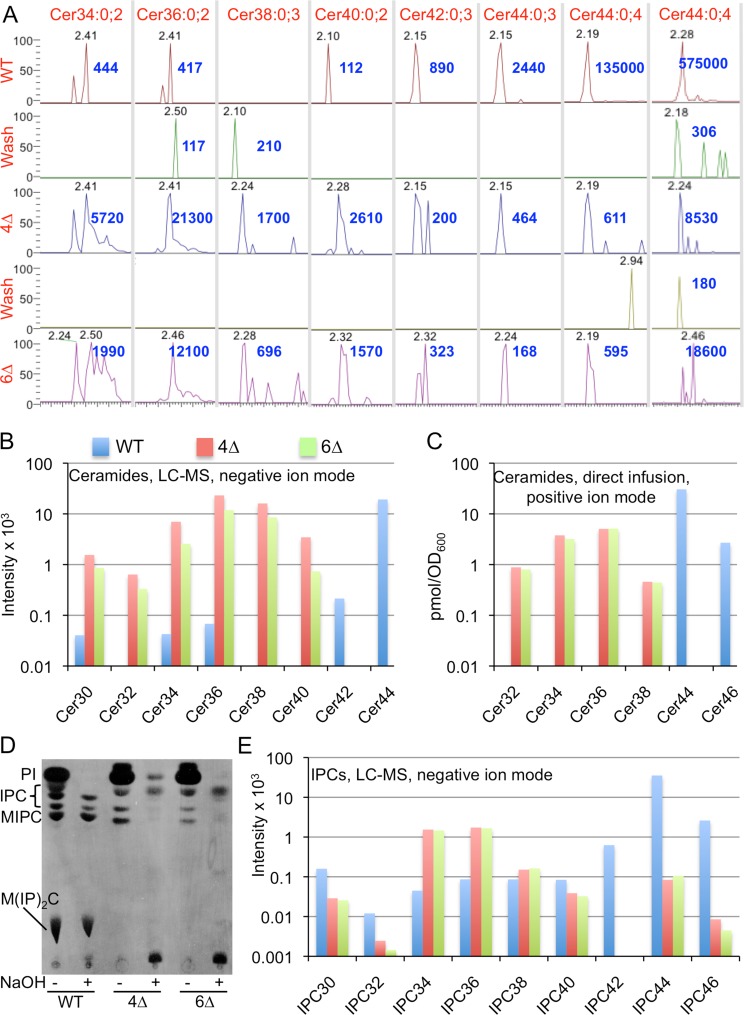
Fig 2. Analysis of ceramides and IPCs in WT, 4∆ and 6∆ by LC-MS(A, B and E) or by direct infusion MS (C).
A. Extracted ion chromatograms (XIC) in negative ion mode of LC-MS analysis in time window where ceramides elute. (Cer44:0;4 is also shown in positive ion mode in the last column to the right). Elution times of peak signals for each ceramide species in minutes are in grey, apexes were set to 100% and the intensity at the apex indicated in blue. Only major species are shown. B. For experiment of panel A, the average intensity across the width of the entire LC peak for each ceramide species was determined and these averages for the various ceramides having a given number of C atoms were summed up and plotted. C. In an independent experiment lipid extracts were analyzed by direct infusion-FTMS and after addition of Cer35:1;3 as an internal standard. D. WT, 4∆ and 6∆ cells were labeled with [3H]inositol for 2 h and lipid extracts before and after deacylation were analyzed by TLC and autoradiography. E. In the experiment of panels A and B, IPCs were calculated and plotted as was done for ceramides in panel B.

