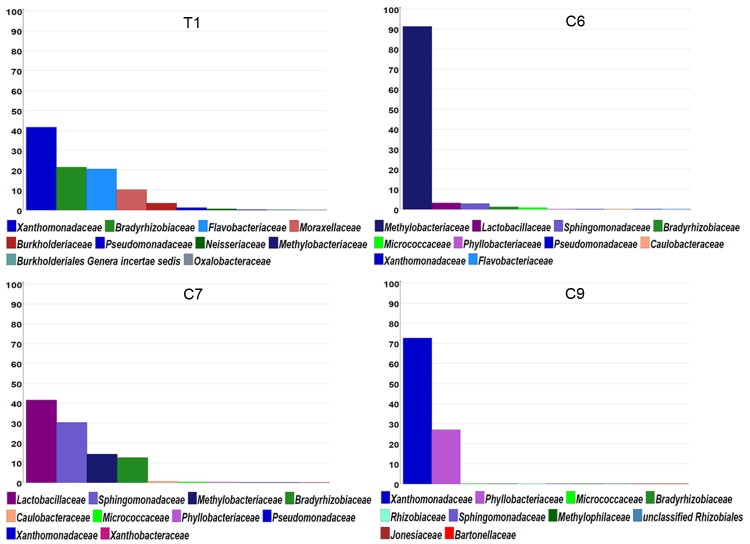
Figure 2.
The distribution of taxonomic classification at the level of Families for all qualified merged paired reads of 16S rRNA sequences amplified from the diseased lung tissue and early-stage blood cultures set up with R5 medium (C6), SP4_F medium (C7) and BCF medium (C9). Only the top 10 families for each sample are shown in the MEGAN display.

