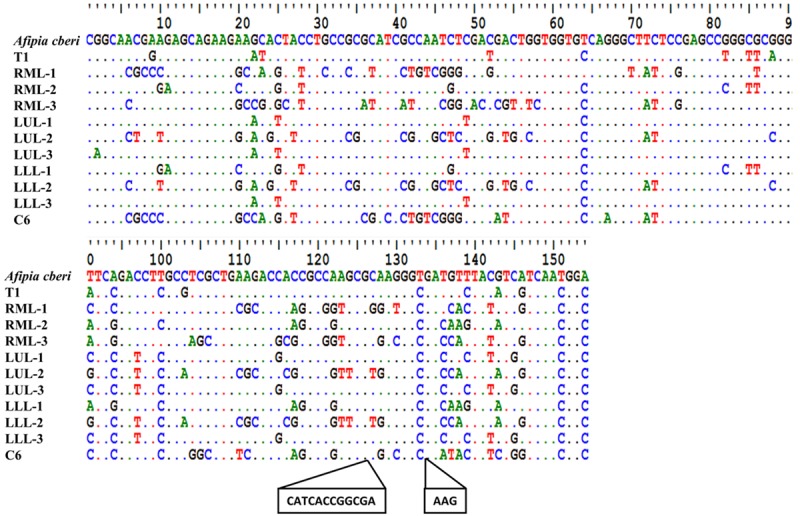
Figure 5.

Alignment of amplicon sequences obtained using the BAMQ#8 primer set from different lobes of the patient’s diseased lung tissues and from early-phase R5 culture of a blood sample with that of A. cberi. Sequences of amplicons from T1 and C6 samples were obtained using the Sanger Method. Sequencing of amplicons from FFPE autopsy lung tissues, right middle lobe, left upper lobe and left lower lobe (RML, LUL and LLL), that failed using the Sanger method were sequenced through MPS using MiSeq. Sequences of the three most-abundant reads from each amplicon sequenced by MPS were used for the alignment. The sequence variations seen between the high-abundance reads from the autopsy lung tissues and those of A. cberi are marked. The amplicon of the C6 sample was found to be distinct with 15 nts longer in size compared to the expected amplicons from Bradyrhizobiaceae microbes. Since phylogenetic analysis showed that more than 90% of microbial populations in the C6 sample were Methylobacteriaceae microbes (Figure 1), the C6 amplicon sequence was likely from microbes of Methylobacteriaceae, not Bradyrhizobiaceae.
