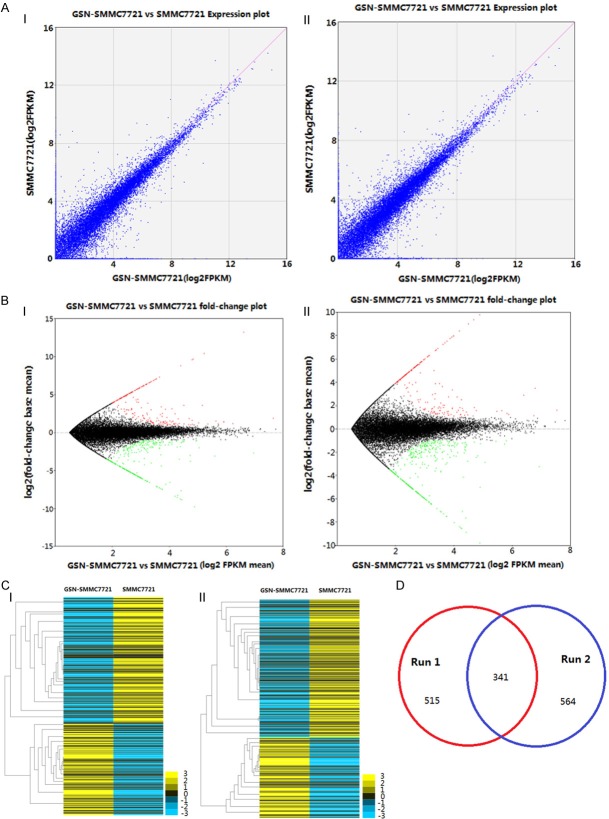
Figure 2.
DEGs and cluster analysis for two runs of RNA-seq. A. The scatter plot for global expression in two runs. The normalized gene expression was measured by FPKM. B. log2 ratioplot for all the genes in two runs. The red and green dots indicated that up- and down-regulated DEGs were significant at P values less than 0.05. C. Hierarchical clustering of DEGs in two runs. D. Venn diagram to illustrate the overlapped DEGs between two runs.

