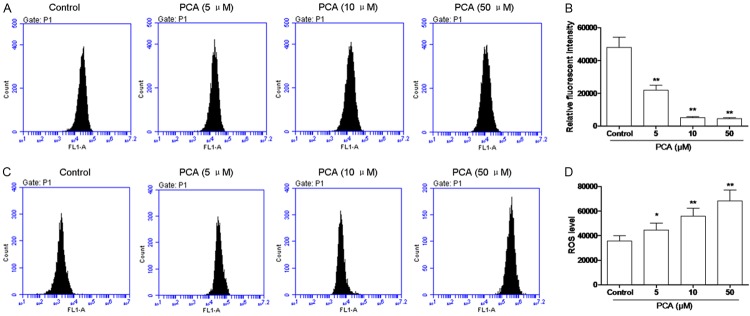
Figure 4.
Effects of PCA on MMP and ROS in HL60 cells. A, B. Cells were treated with PCA for 24 h at 5, 10, and 50 μM respectively, then incubated with Rhodamine 123 and analyzed by flow cytometry. C, D. Cells were treated with PCA for 24 h at 5, 10, and 50 μM respectively, and fluorescence probe DCFH-DA was used to determine the levels of ROS production. Data was presented as mean ± SD (n = 3). *P<0.05, **P<0.01, compared with the control group.

