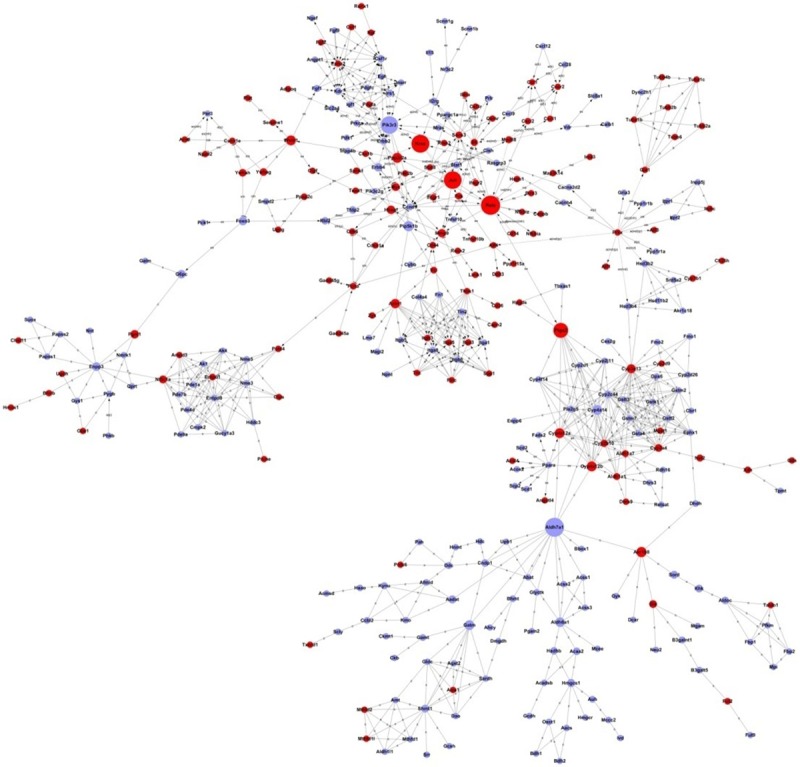
Figure 2.

Signal-Net analysis of differentially expressed genes in rhabdomyolysis-induced AKI. Circles represent genes (red shows upregulated, blue shows downregulated). The size of the circle represents the number of other genes that interact with this gene. Lines indicate interactions between genes Pathways in rhabdomyolysis-induced AKI.
