
Figure 3.
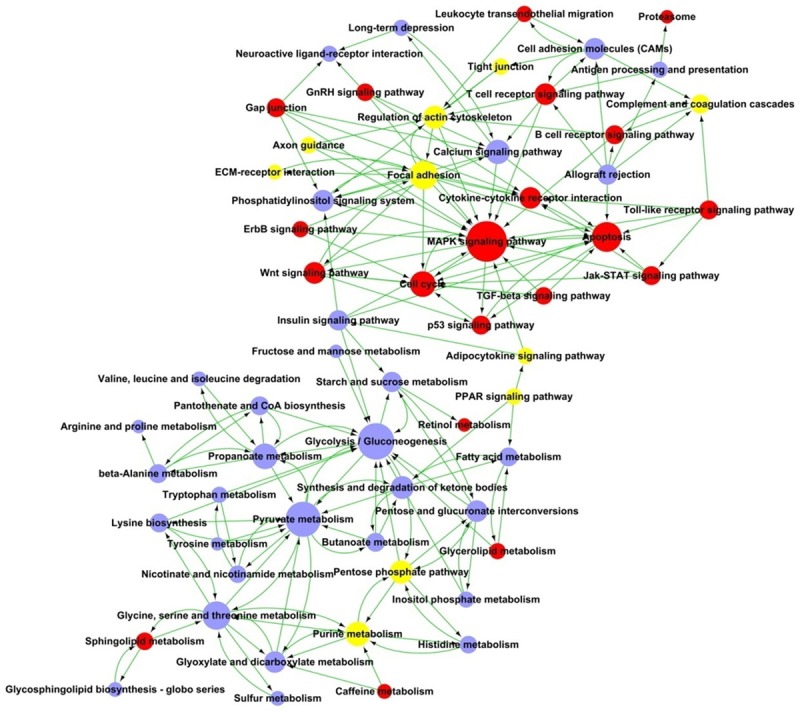
Path-Net analysis of differentially signaling pathways in rhabdomyolysis-induced AKI. Circles represent pathways (red shows upregulated, blue shows downregulated, yellow represents for both up- and down-regulated pathways). The size of the circle represents the number of other genes that interact with this gene. Lines indicate interactions between pathways in rhabdomyolysis-induced AKI.