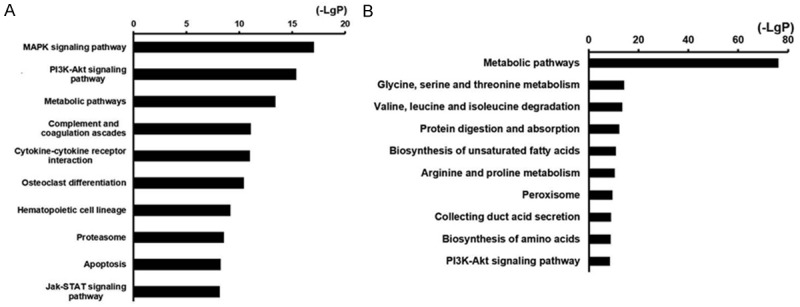
Figure 4.

Histogram of top10 signal pathways that were significantly different in rhabdomyolysis-induced AKI showing (A) upregulated pathways; (B) Downregulated pathways. X axis, negative logarithm of the P value (-LgP); Y axis, the name of the pathway. The larger the value, the smaller the P value.
