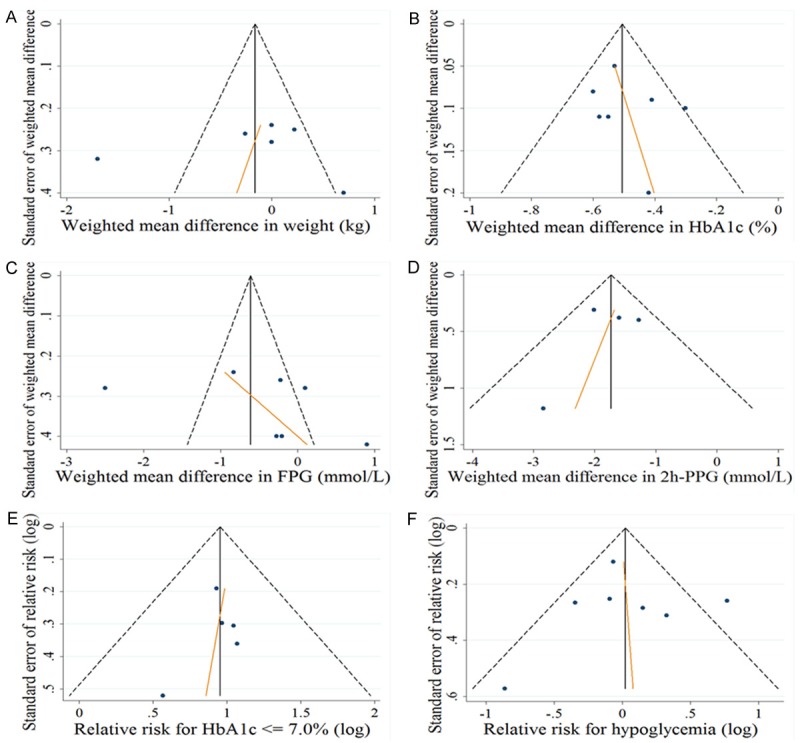
Figure 2.

Funnel plot with Egger’s test was employed to assess the risk of publication bias for the changes in (A) body weight (kg), (B) HbA1c (%), (C) FPG (mmol/l), (D) PPG (mmol/l), (E) relative risk for HAb1c ≤ 7.0%, and (F) relative risk for hypoglycemia episodes.
