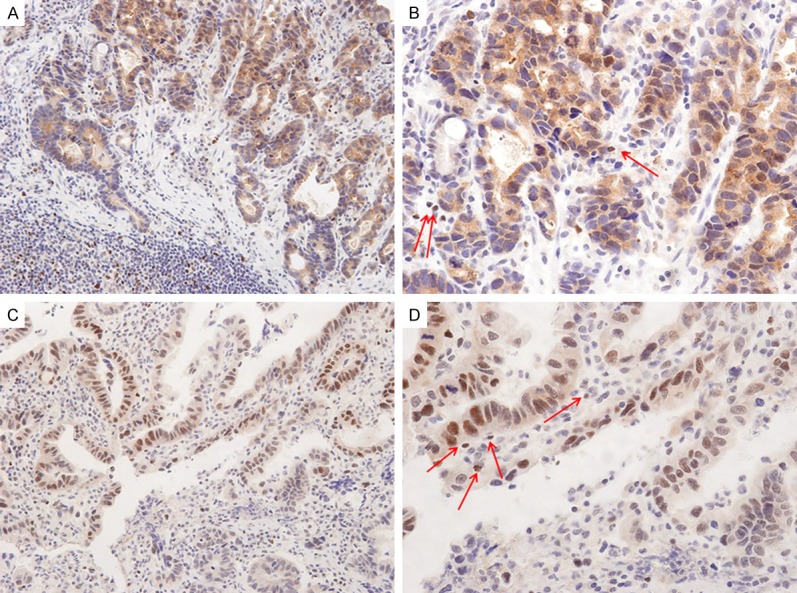
Figure 1.

Representative photographs of FOXP3 expression in gastric adenocarcinomas. (A) Strong tumoral FOXP3 expression in nucleus and cytoplasm of gastric adenocarcinomas (original magnification, ×100). (B) Magnified view of (A) (original magnification, ×200). The carcinoma cells show granular cytoplasmic with focal nuclear tumoral FOXP3 expression. The tumor stroma also shows some FOXP3 positive Tregs (red arrows). (C) Another case of gastric adenocarcinoma shows strong tumoral FOXP3 (original magnification, ×100). (D) Magnified view of (C) (original magnification, ×200). Many carcinoma cells show strong nuclear tumoral FOXP3 expression. The tumor stroma also shows some FOXP3 positive Tregs (red arrows).
